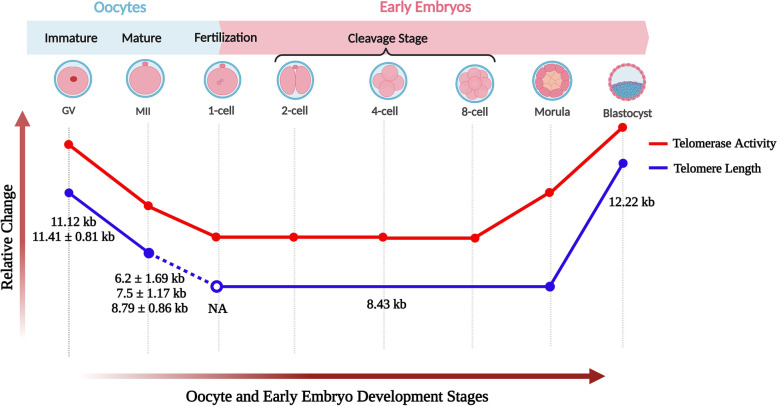
Fig. 3.
Telomere length and telomerase activity in human oocytes and early embryos. Both parameters show similar relative changes in the oocytes from germinal vesicle to metaphase II (MII) stages and in the early embryos from 1-cell to blastocyst stages. Telomere length and telomerase activity level decreased from GV oocytes to 1-cell embryos, remained stable from 1-cell to 8-cell/morula stage embryos and remarkably increased in blastocysts. The exact telomere length(s) (mean ± SD/SEM) of each oocyte and embryo stage is given below as a blue line. It is important to note that the telomere length of 8.43 kb was determined in the pool of cleavage stage embryos. NA, not analyzed; kb, kilo base pairs. This schematic diagram was created using the BioRender Program (BioRenderCompany; Toronto, Canada)

