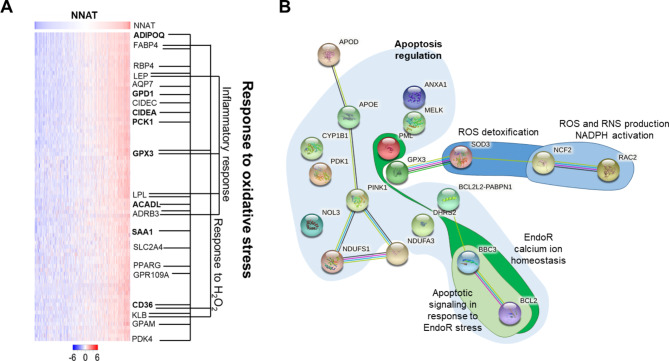
Fig. 1.
NNAT expression correlated with ROS and PPAR signal-transduction pathway in TCGA-BRCA ER + cohort and ER + breast cancer cells. A Gene expression that correlates with NNAT expression in breast cancer patients. Analysis of NNAT mRNA expression in TCGA-BRCA from ER + tumors (n = 699). Data are presented as log expression values and mean values are statistical different between groups (2.2 × 10− 16), as tested by ANOVA. B The most significant modules of oxidative stress genes selected from protein–protein interaction network upregulated by NNAT overexpression in both ZR75 and T75D cell lines

