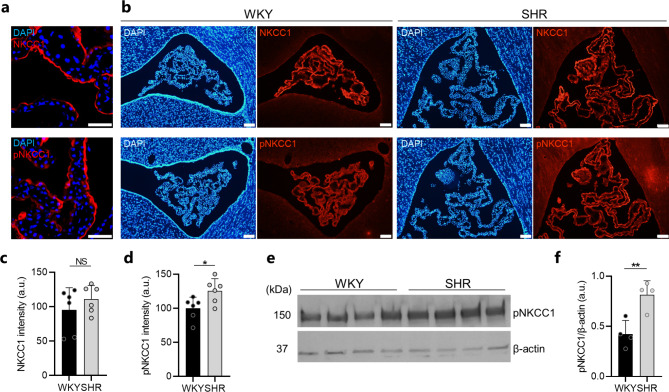
Fig. 2.
The SHR choroid plexus demonstrates upregulation of pNKCC1. a Confocal microscopy images demonstrating apical localization of NKCC1 (red, top panel) and pNKCC1 (red, lower panel) in SHR choroid plexus. Cell nuclei are stained with DAPI (blue). Scale bar: 50 μm. b Representative immunofluorescence images of the choroid plexus from WKY rats (left panels) and SHRs (right panels) stained for NKCC1 (red, top panels), pNKCC1 (red, lower panels), and cell nuclei (DAPI, blue). Scale bar: 100 μm. c-d Quantification of NKCC1 (c) or pNKCC1 (d) fluorescence intensity in choroid plexus from WKY rats and SHRs, n = 6 in each group. e Western blot of pNKCC1 in choroid plexus from WKY rats and SHRs. β-actin served as loading control. f quantification of pNKCC1 abundance in choroid plexus from WKY rats (n = 4) and SHRs (n = 4) normalized to β-actin. Error bars represent standard deviation and statistical significance was tested with an unpaired two-tailed t-test or a Mann-Whitney test. * P < 0.05, **P < 0.01, NS = not significant

