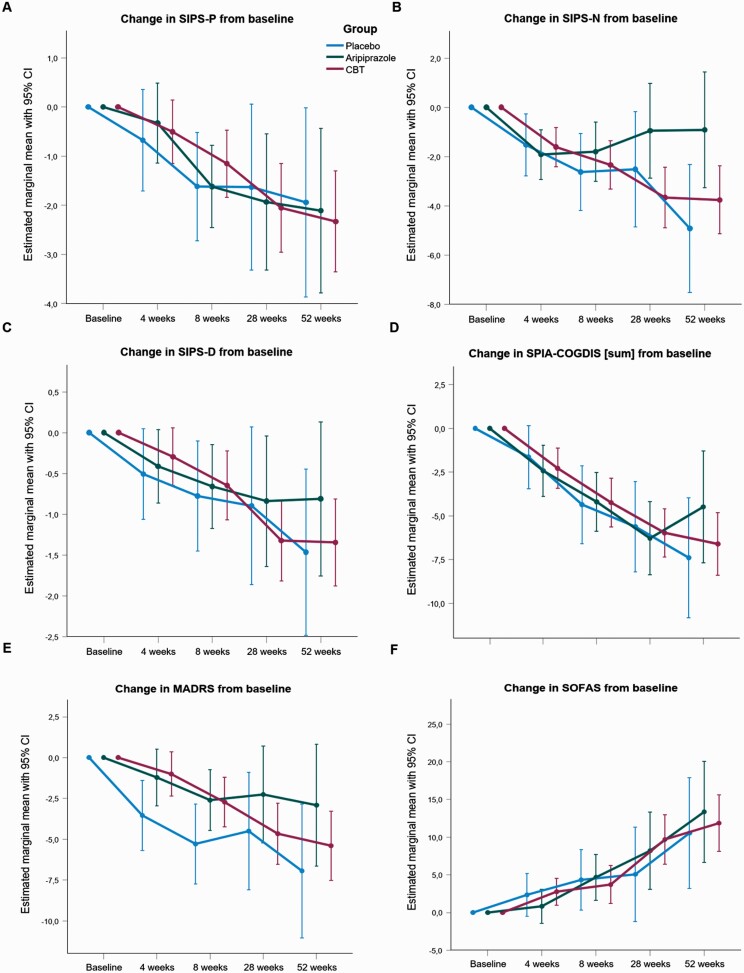
Fig. 3.
Linear mixed models fixed effects (change from baseline ) plots A) of (attenuated) positive symptoms (SIPS-P), B) negative symptoms (SIPS-N), C) disorganized symptoms (SIPS-D), D) predictive basic symptoms' cognitive disturbances' cluster (COGDIS), E) Montgomery-Åsberg Depression Rating Scale (MADRS), F) Social and Occupational Functioning Assessment Scale (SOFAS).

