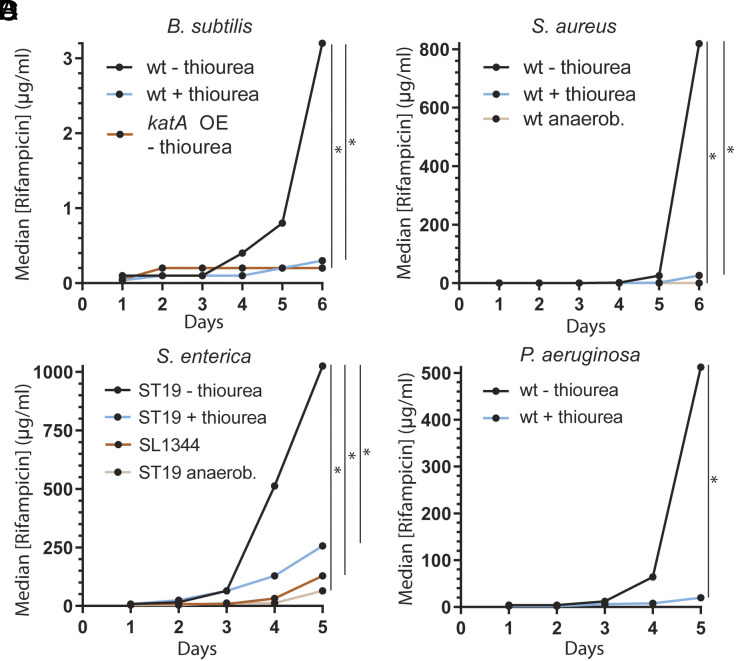
Fig. 1.
Oxidative stress drives the evolution of antibiotic resistance. Median concentration of rifampicin that allows for growth in the indicated strains at each sampled timepoint. 50 mM (A–C) or 10 mM (D) thiourea was included in the media when indicated. 1 mM IPTG was added for katA overexpression. n = 23 (B. subtilis – thiourea, rifampicin), 12 (B. subtilis + thiourea, rifampicin), 24 (B. subtilis katA overexpression, rifampicin), 12 (S. aureus – thiourea), 12 (S. aureus + thiourea), 12 (S. aureus anaerobiosis), 35 (S. enterica serovar Typhimurium ST19), 34 (S. enterica serovar Typhimurium ST19 + thiourea), 24 (S. enterica serovar Typhimurium SL1344), 12 (S. enterica serovar Typhimurium ST19), 22 (P. aeruginosa – thiourea), 12 (P. aeruginosa + thiourea) biological replicates. Statistical significance was assessed with a two-tailed Mann–Whitney U test, *P < 0.05.

