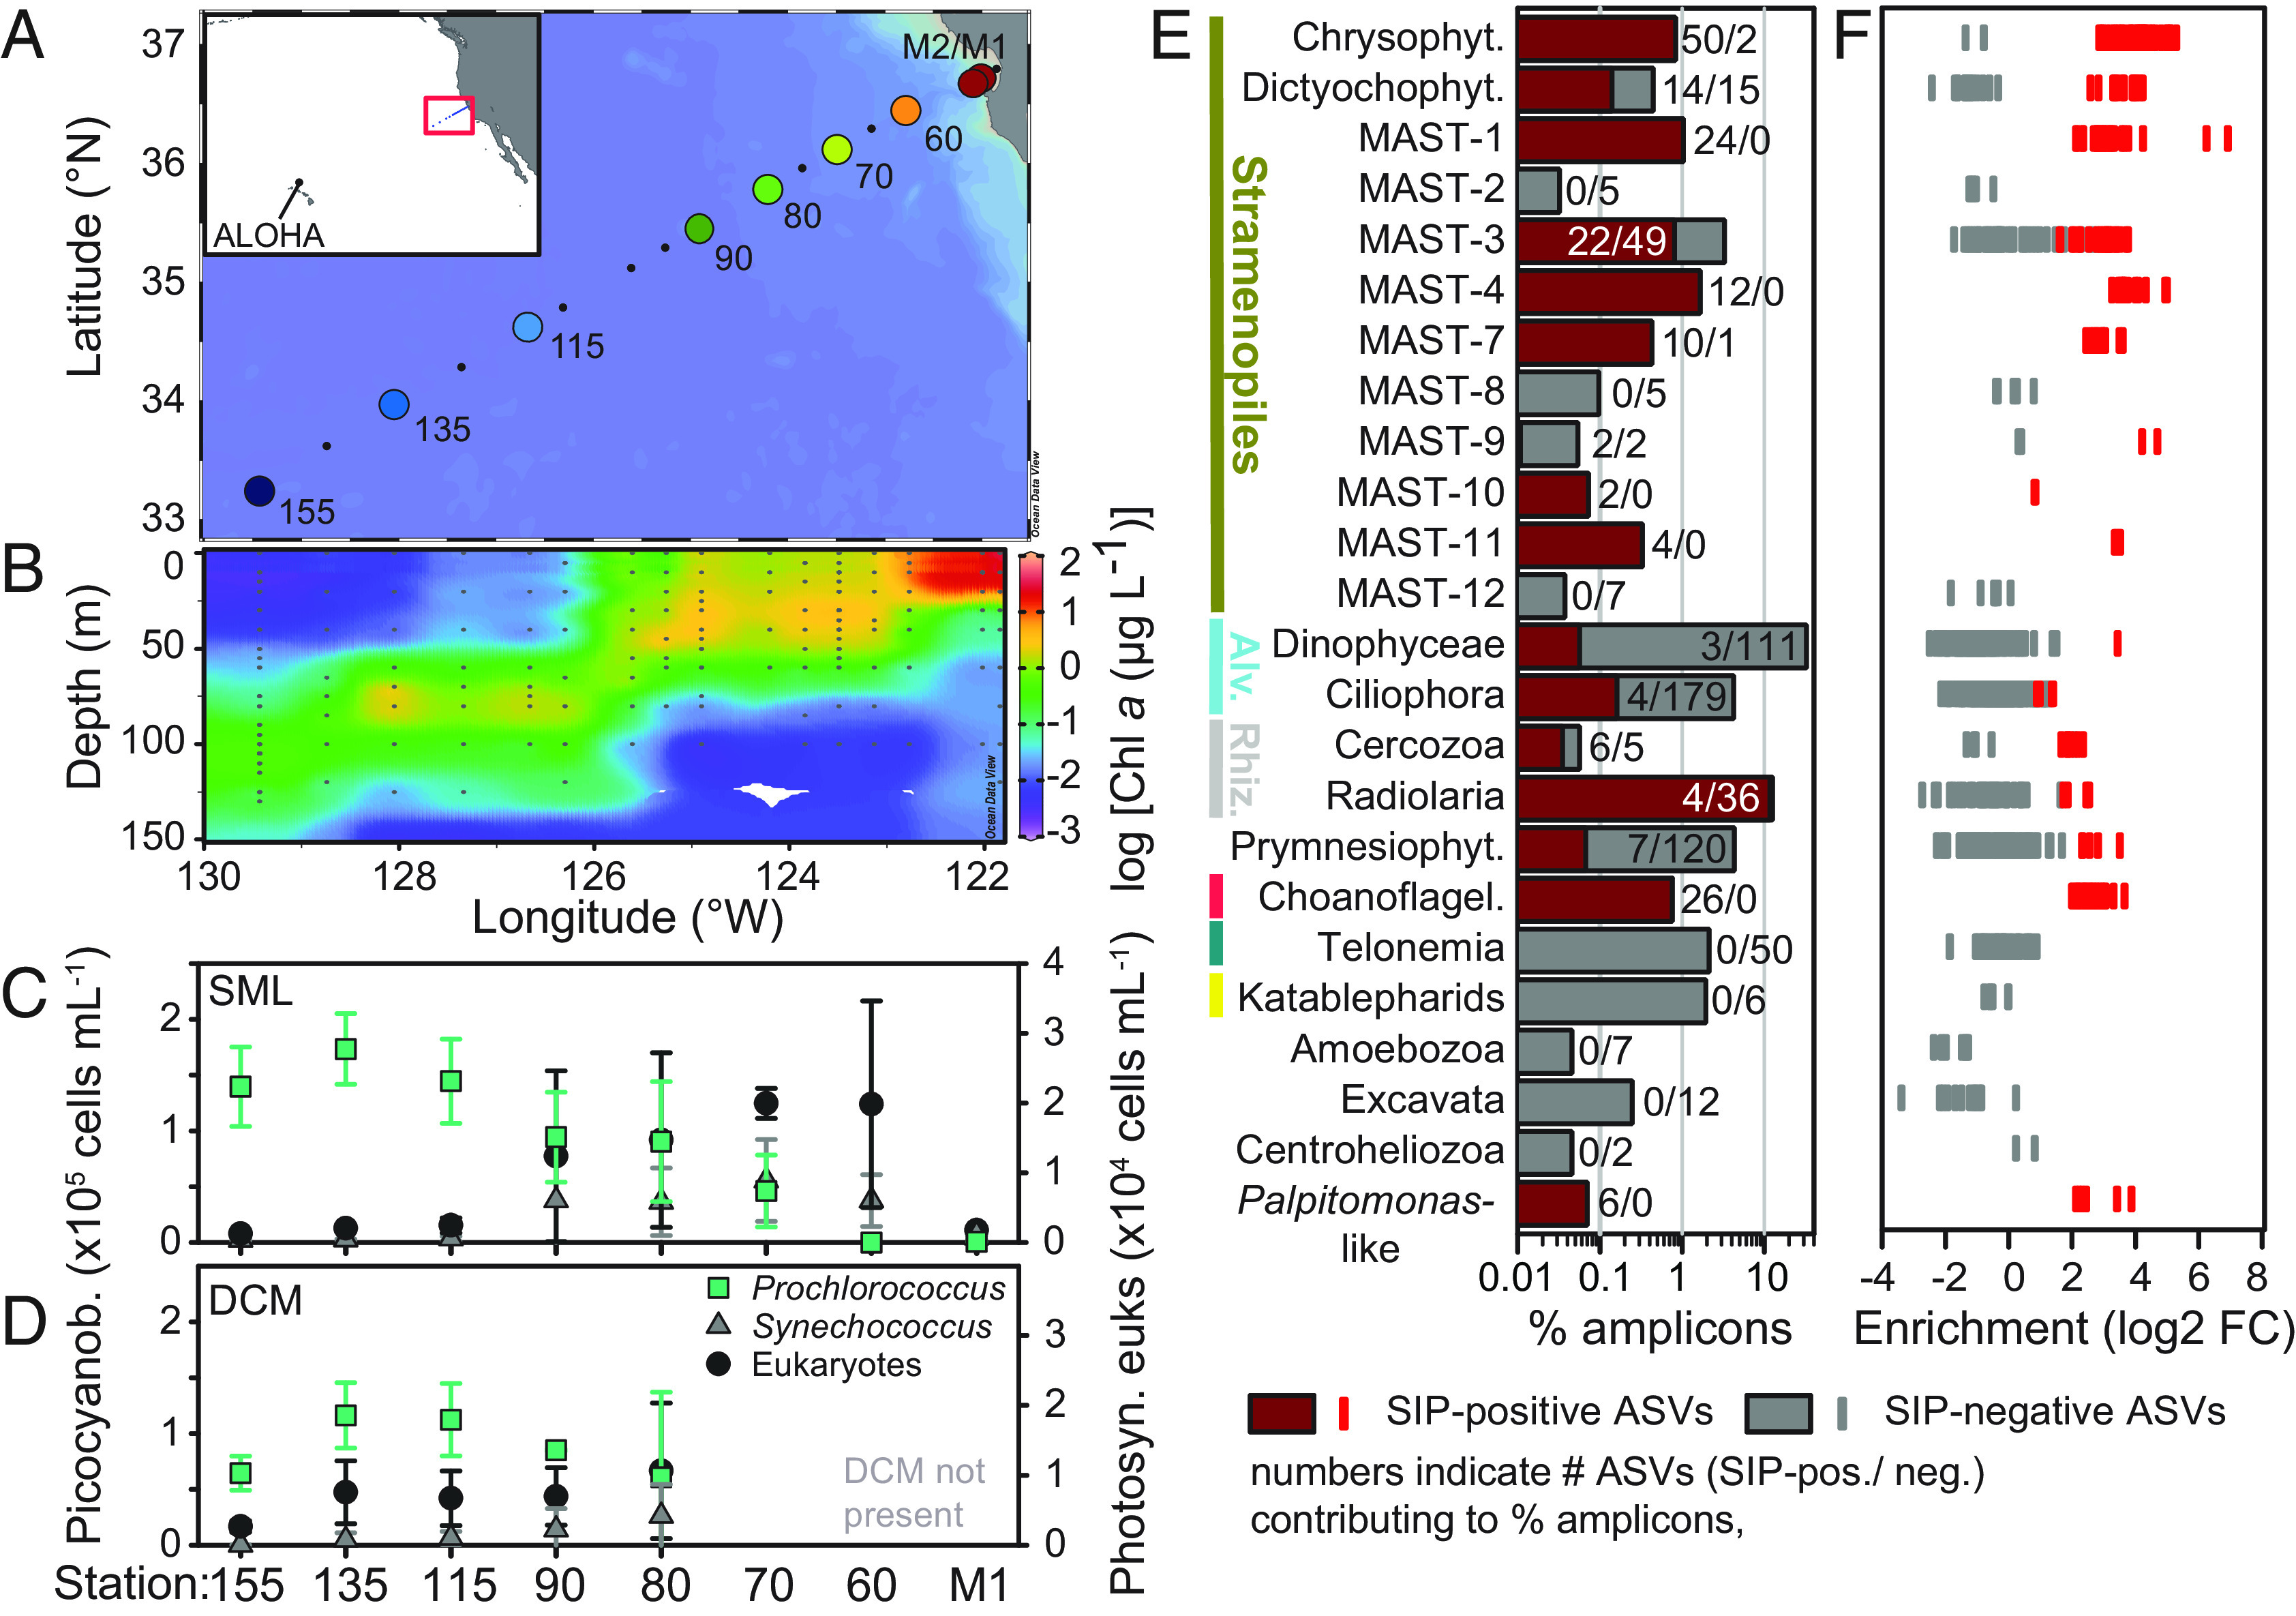
Fig. 1.

Phytoplankton prey communities from the coast to open ocean and predatory protists feeding on Prochlorococcus. (A) Stations sampled and overall Pacific region (Inset). (B) Chlorophyll a concentrations (2009 only for simplicity) show the development of a DCM offshore. (C and D) Mean cell abundances (±SD) of Prochlorococcus, Synechococcus, and eukaryotic picophytoplankton in the (C) Surface Mixed Layer (SML) and (D) DCM (if present), generally from 6-y annual sampling. Transect mid-region data are variable due to interannual shifts (13). (E) Relative contributions of protistan groups identified as feeding (maroon) and those not feeding on Prochlorococcus (gray) to total 18S-V9 rRNA amplicons in the RNA-SIP experiment at 67-80. Note: log scale. (F) Relative enrichment in amplicon abundance in heavy fractions of the density gradient due to isotope incorporation in 13C/15N-labeled treatments compared to the same fractions from the controls (12C/14N). Shown is the average enrichment across all five heavy density windows per ASV (see also Dataset S2).
