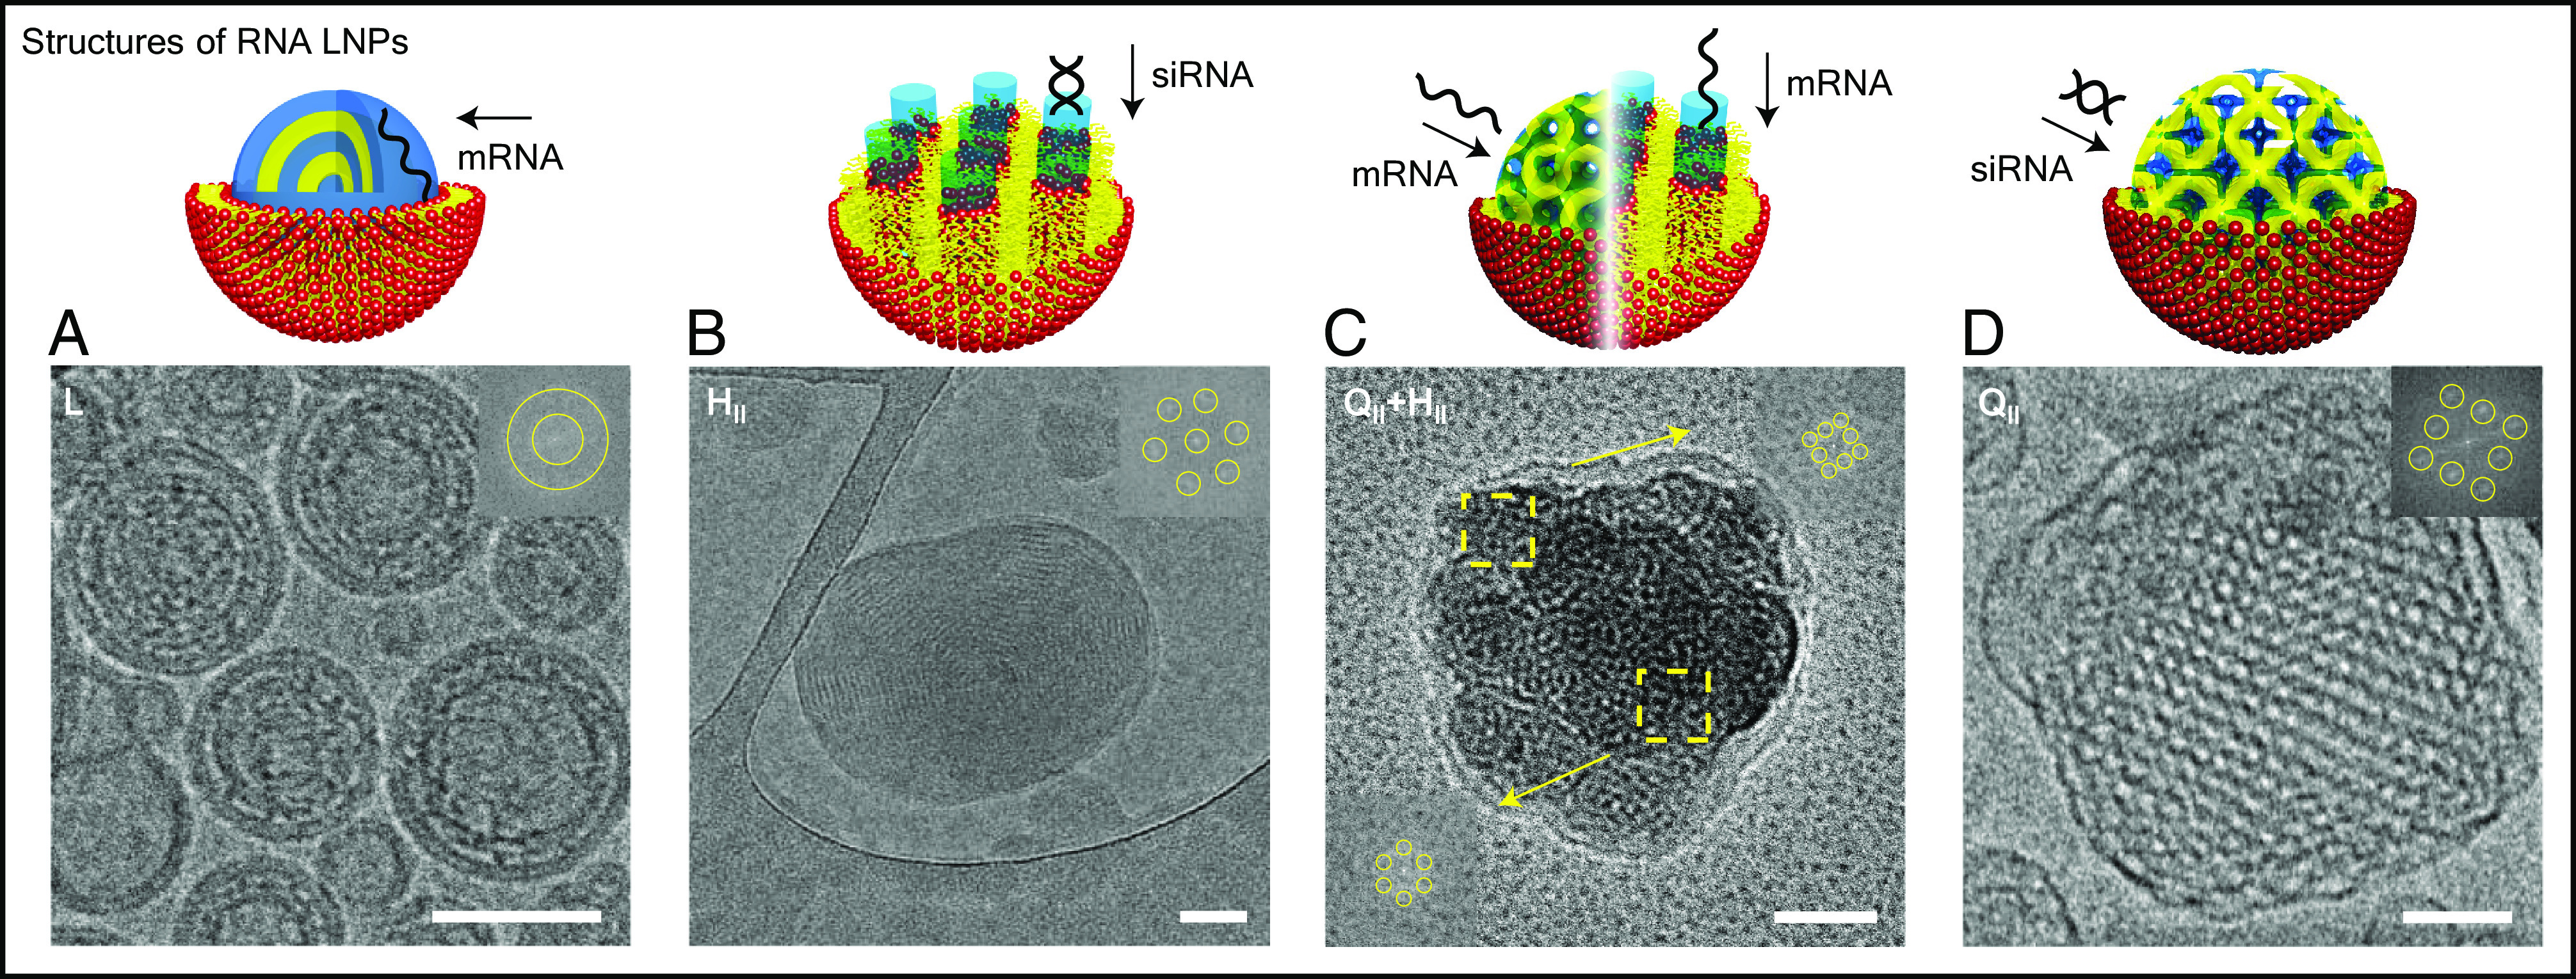
Fig. 3.

Representative cryo-EM images of LNP–RNA complexes with insets representing the fast Fourier transforms (FFT). (Scale bar, 50 nm.) (A) Cryo-EM micrograph of lamellar phase LNP–RNA complexes. These complexes were formed with a lipid composition of DOPC/DOTAP/DOPE-PEG at molar ratio 85/14/1 and with mRNA at ρ = 6. (B) Cryo-EM micrograph of a hexagonal phase LNP–RNA complex. This complex has a lipid composition of GMO/DOTAP/DOPE-PEG at molar ratio 85/14/1 and with siRNA at ρ = 3. (C) Cryo-EM micrograph of an LNP–RNA complex with coexisting hexagonal and bicontinuous cubic phases. The complex was formed with a lipid composition of GMO/DOTAP/DOPE-PEG at molar ratio 85/14/1 and with mRNA at ρ = 6. (D) Cryo-EM micrograph of an LNP–RNA complex with the bicontinuous cubic phase. Adapted with permission from ref. 40. Copyright 2018 American Chemical Society.
