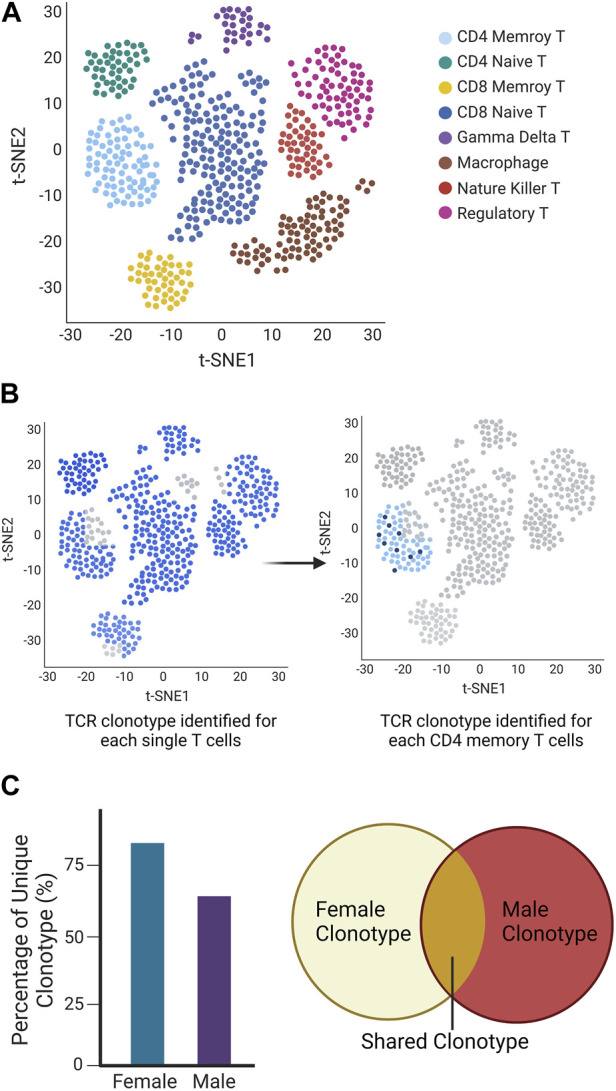
FIGURE 2.

Mockup Chromium Single Cell Immune Profiling (10X Genomics) to identify the specific immune cell subsets and the expressed TCR repertoire of single T cells. (A) UMAP of the different cell types is classified based on different colors. (B) TCR repertoires in each T cell (left) and selected memory T cell (right). Each cell identified with a TCR clonotype was labeled blue, otherwise was grey (no identified TCRα/β or TCRγ/δ present). The same clonotype is marked in the same dark blue color (right). (C) The different clonotypes expansion between sexes showed as a percentage of unique clonotypes, and share clonotypes were presented in Venn diagram.
