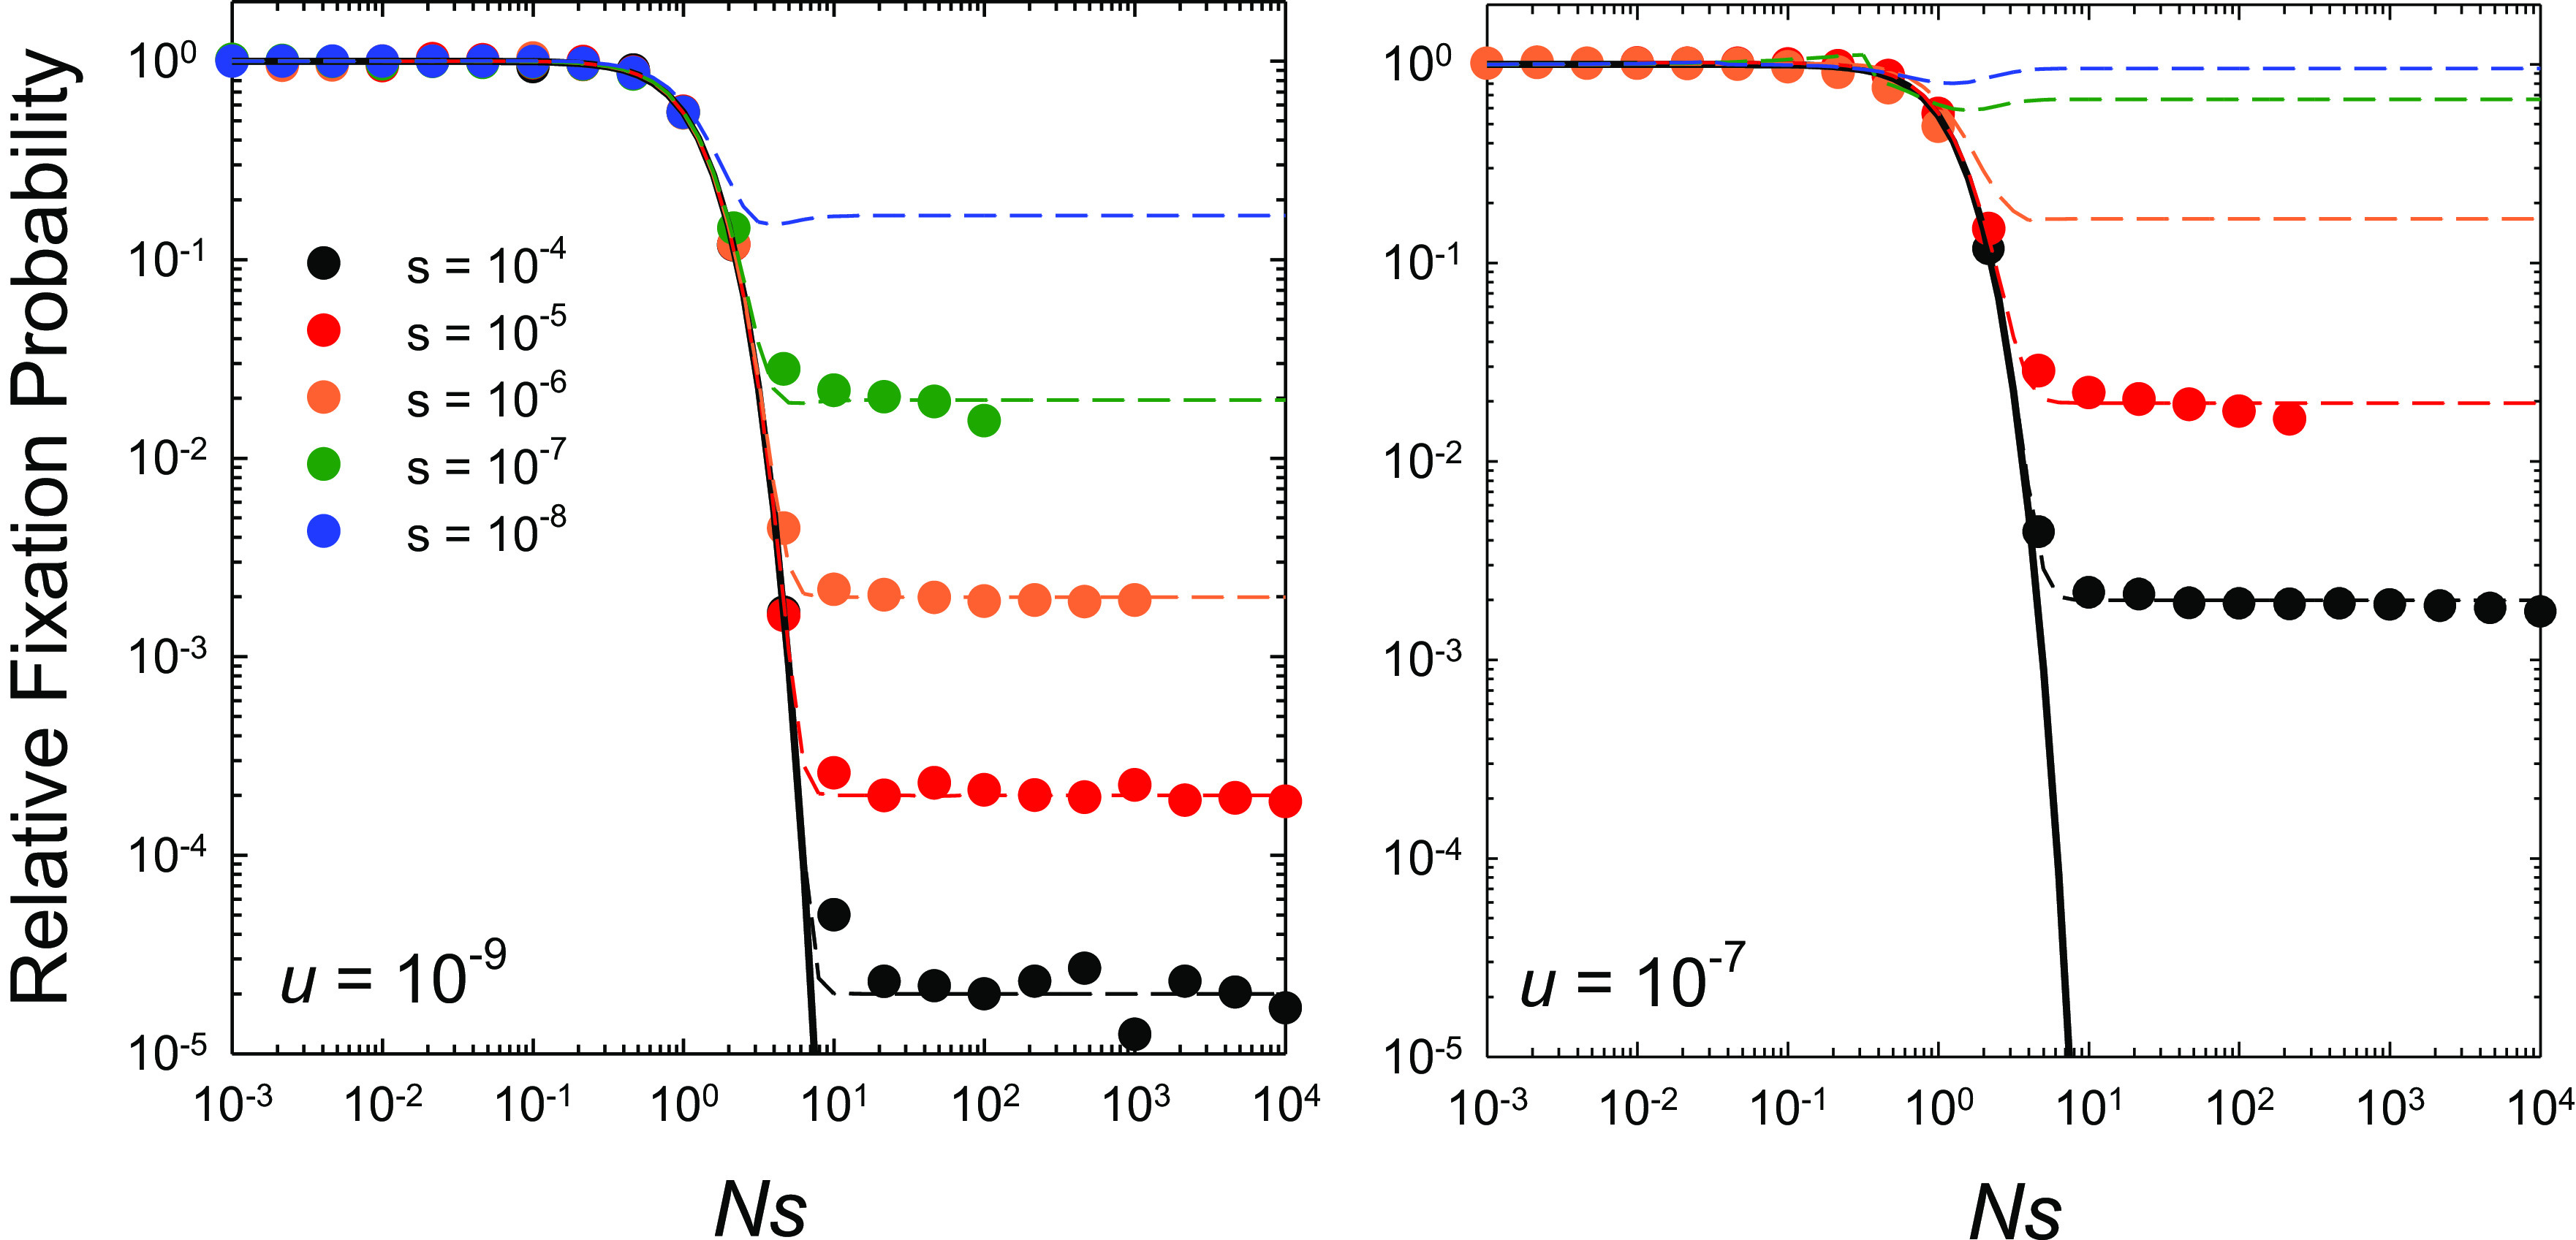
Fig. 2.

Rates of substitution at the two sites scaled to the neutral expectation as a function of Ns (the ratio of the strength of selection to drift), for the case of complete linkage with both sites experiencing equal mutation rates, selection coefficients (s = s2 = s3 and s4 = 0), and population sizes. The data points denote computer-simulation results, obtained over a range of Ne from 103 to 109 for each set of s and u. The solid black line denotes the sequential-model prediction, which is independent of the mutation rate (Eq. 7), whereas the horizontal dashed lines extend to the stochastic-tunneling domain (Eq. 9) and do depend on the mutation rate. Simulation data on fixation rates are only given when the population-level mutation rate per site Nu < 0.1 and the deterministic expected frequency of the deleterious type ≃u/s < 0.1, as otherwise recurrent mutations make it difficult to accurately ascertain fixation events from observed allele frequencies that become bounded away from 1.0.
