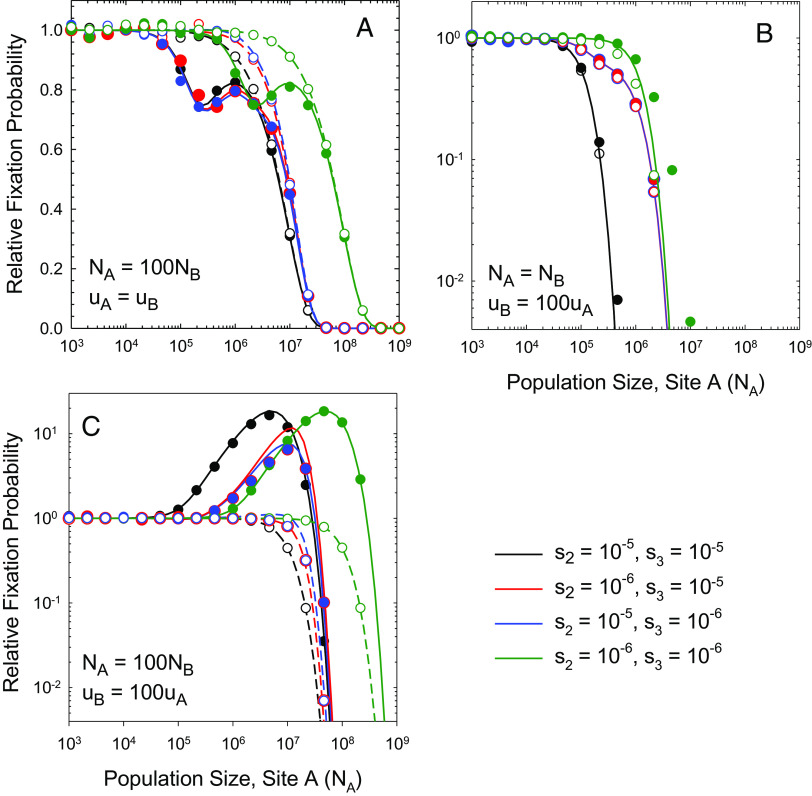
Fig. 4.
Scaled rates of substitution at the two sites relative to the neutral expectation as a function of NA (the population size at the A/a locus), for the case of free recombination and asymmetry in the strength of selection (s2 ≠ s3), with various combinations of effective population sizes and mutation rates between sites. In all cases, uA = 10−9. Solid and dashed lines, derived from theory, denote results for the A and B loci, respectively. Parameters in the four panels are set as: (A) , ; (B) , ; and (C) , .

