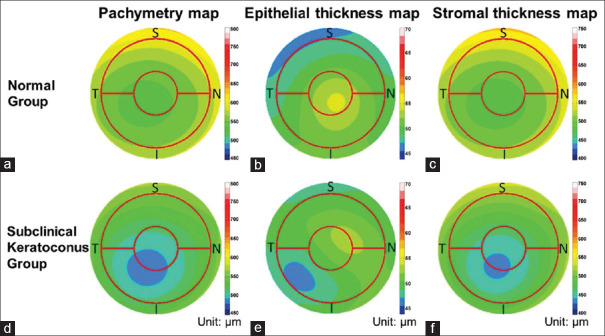
Figure 3.
Average pachymetric, corneal epithelial, and stromal thickness maps of normal (a-c) and subclinical keratoconus eyes (d-f). Maps of the left eyes that were included were mirrored before averaging. The red circles overlaid on the map had diameters of 2.0 mm and 5.0 mm. The color scale represents the thickness in microns. I: Inferior, N: Nasal, S: Superior, T: Temporal

