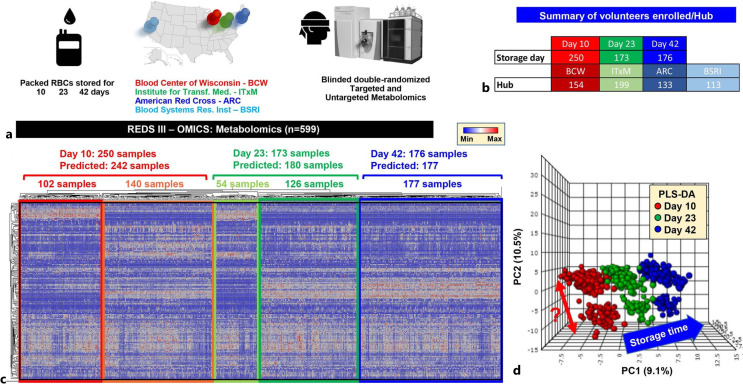
Fig. 2.
Metabolomics analyses of REDS-III samples [32]. a An overview of the study design. b A breakdown of the number of patients enrolled in this arm of the study at four different blood centers (BCW; ITxM, Pittsburgh; ARC at Yale; University of California at San Francisco and BSRI). c The heat map shows the results from unsupervised hierarchical clustering of 599 samples based on metabolic phenotypes. A total of 242, 180, and 177 samples were predicted to belong to storage day 10, 23, and 42 categories, with only 8 samples misclassified as storage day 23 belonging to the day 10 and day 42 groups. d Partial least square discriminant analysis in dataset done after unblinding showing sample clustering based on storage time across principal component 1 (explaining 9.1% of the total variance). Of note, a clear subcluster was observed across PC2 (10.5% of the total variance. Color code: red – day 10 samples; green – day 23 samples; blue – day 42 samples. This figure is reproduced from D’Alessandro et al. [32]. BCW, Blood Center of Wisconsin; ITxM, Institute for Transfusion Medicine; ARC, American Red Cross; BSRI, Blood Systems Research Institute.

