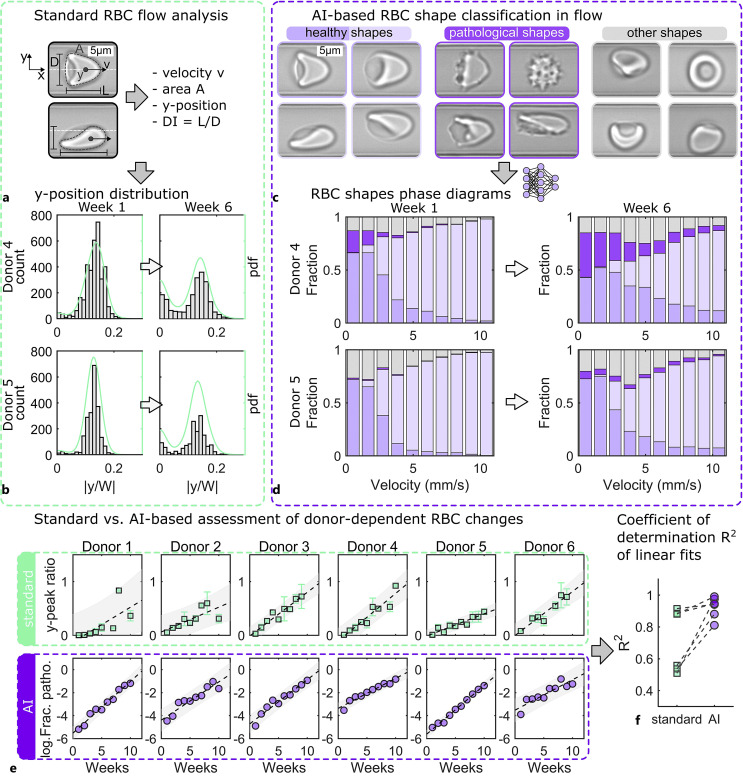
Fig. 4.
Standard and artificial intelligence (AI)-based analysis of single-cell microfluidic flow behavior of stored RBCs. a Representative images of a croissant-shaped RBC (top) and a slipper-shaped RBC (bottom) in a microfluidic capillary with a height of H = 8 µm and width of W = 11 µm recorded by the Erysense technology. Based on these images, standard flow analysis can determine the RBC velocity, projection area, y-position, and deformability index DI. b Histogram and probability density functions (pdf) of the normalized RBC y-position for two donors at week one and week six after storage. c Characteristic healthy, pathological, and other RBC shapes during capillary flow. d AI-based assessment of RBCs during flow. RBC shape phase diagrams, i.e., the fraction of the RBC shape classes shown in c as a function of the RBC velocity for the same donors and points in time as for b. e Comparison of the standard (top) and AI-based (bottom) evaluation of donor-dependent changes in the RBC microcapillary flow behavior. Dashed black lines correspond to linear fits. Gray areas indicate an estimate of a 95% prediction interval. In the standard approach, the y-peak ratio describes the ratio between centered and off-centered RBCs concerning the channel center in the y-direction based on probability density functions (pdfs) at velocities between 7 mm/s and 10 mm/s. For the AI approach, the y-axis of e shows the logarithm of the fraction of pathological RBC shapes based on the shape phase diagrams of d. f Comparison of the coefficient of determination for the linear fits shown in e. Dashed lines connect data points for the same donor analyzed with the standard and the AI approach. This figure was reproduced from data presented by Recktenwald et al. [22].

