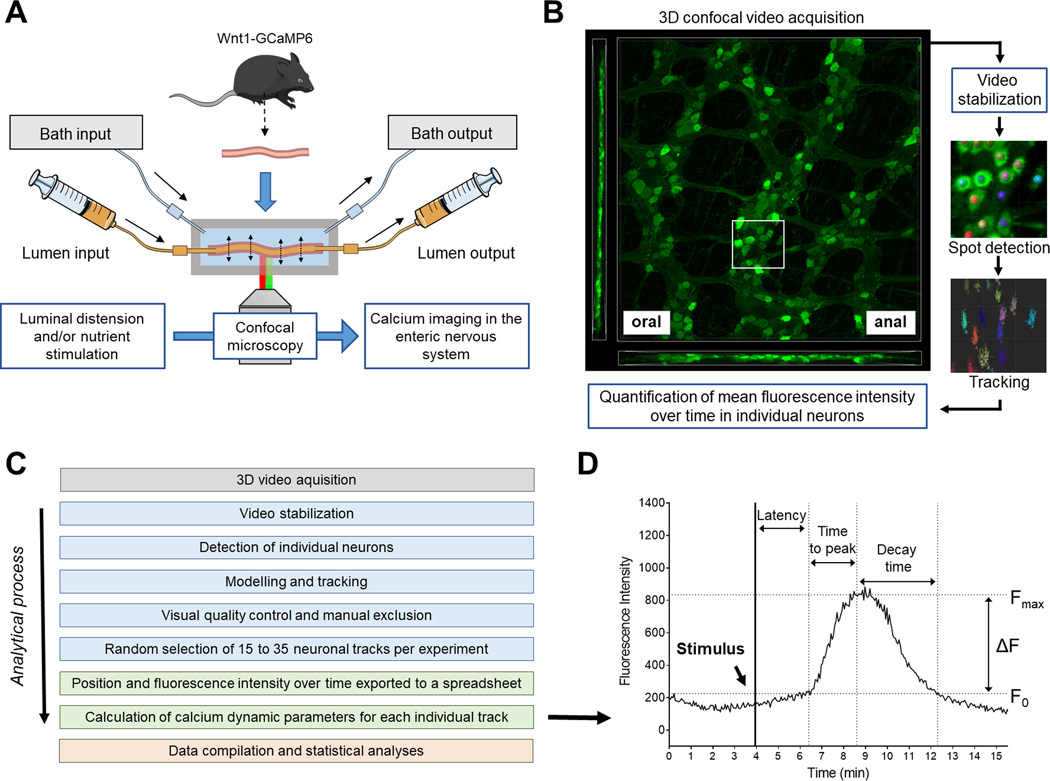
Figure 1.
Schematic illustrations of the perfusion chamber, video acquisition and image analysis workflow. (A) Intact intestinal segments from Wnt1-GCaMP6, Calb1-GCaMP6 or Chat-GCaMP6 mice were mounted in a custom-made chamber allowing control of the luminal contents and the level of distension of the preparation. The chamber was placed on the stage of an inverted confocal microscope to perform live cell imaging of enteric neurons without having to dissect the tissue. (B) Three-dimensional (3D) video acquisition of the neuronal plexuses was performed and mean fluorescence intensity over time in individual neurons was quantified. (C) Image analysis workflow (from top to bottom): Blue boxes correspond to analyses made using 3D imaging software Imaris (Bitplane); Green and red boxes correspond to analyses made with Microsoft Excel and Graphpad Prism, respectively. (D) Illustration of the different calcium dynamic parameters measured or calculated for each individual neuron. The initial fluorescence (F0) corresponds to the mean fluorescent intensity immediately before reaction to a stimulus. The maximal intensity (Fmax) corresponds to the highest intensity experienced by a neuron after a stimulus. The difference in fluorescence (ΔF) is equal to Fmax-F0. Individual neurons were considered responsive to a stimulus when their ΔF/ F0 was greater than 15 %; ΔF/F0 < 15 % was considered noise. The “latency” corresponded to the amount of time between introduction of the stimulus and the beginning of the calcium response (determined visually). The “time to peak” corresponded to the amount of time needed for a given neuron to go from F0 to Fmax and the “decay time” is the amount of time needed for a given neuron to go back to F0 after reaching Fmax.

