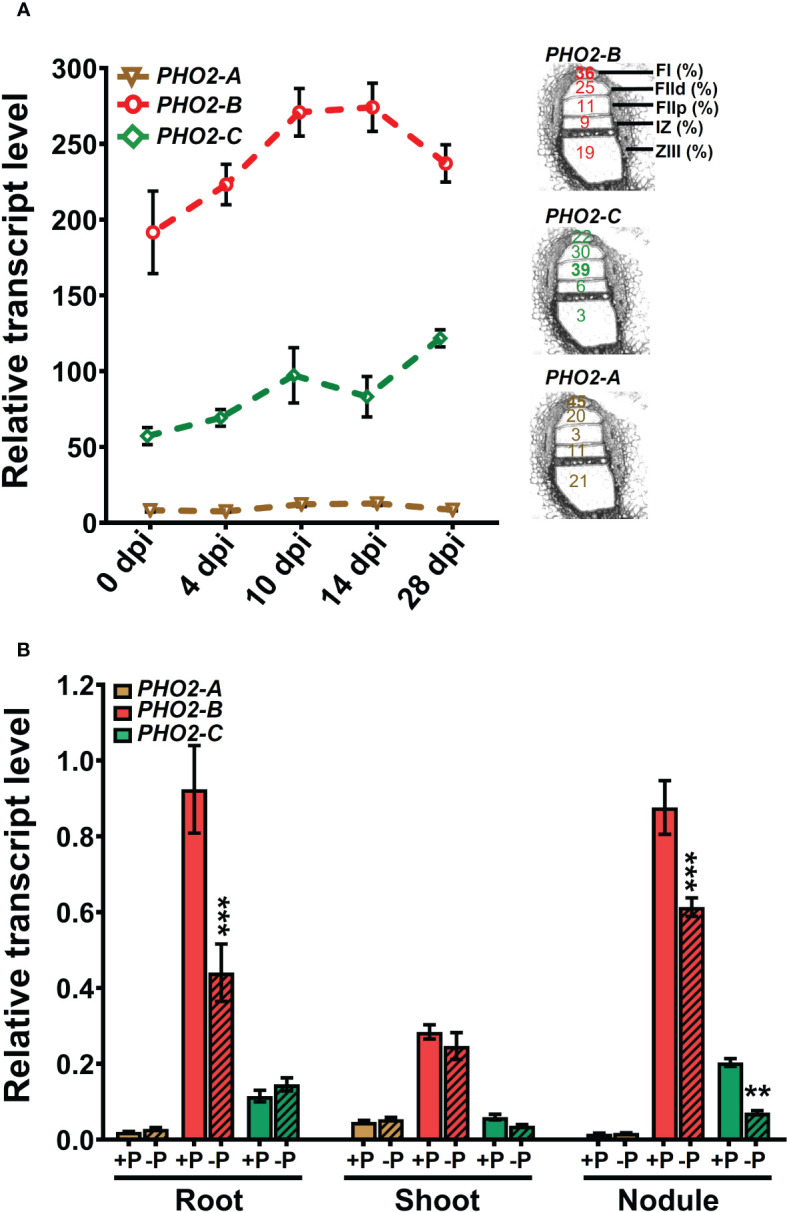
Figure 3.

Expression profiles of Medicago truncatula PHO2 genes in various organs and treatments during nodulation. (A) Relative transcript levels of MtPHO2-A, B and C in nodules over time. Left, RNA-seq data expressed as fragments per kilobase of transcript per million reads mapped (FPKM) represent the average of three biological replicates with standard errors. Further details are given in the MtSSPdb (Boschiero et al. (2020). Right: scheme of the five laser micro-dissected regions of M. truncatula nodules, containing the percentage of normalized counts per region for each PHO2 gene, according to Roux et al. (2014). (B) Relative transcript levels, quantified by qRT-PCR, of MtPHO2-A, B and C genes in four-week-old roots, shoots and nodules of plants grown under symbiotic nitrogen fixation conditions (0.5 mM N and inoculated with S. meliloti strain Sm1021) with optimal-P (+P, 0.5 mM P) or reduced-P (-P, 20 μM P), under the same conditions as those shown in Figures 5 – 8 . PCR primer sequences are presented in Supplementary Table 2 . Data are the mean and SEM of three independent experiments (n=6 for root and shoot, n=18 for nodules). For each replicate, transcript levels were normalized against two housekeeping genes (MtPTB2 and MtPDF2); asterisks indicate significant differences between optimal- and reduced-P, calculated using two-tailed Student’s t-tests (*p < 0.05, **p < 0.01, ***p < 0.001).
