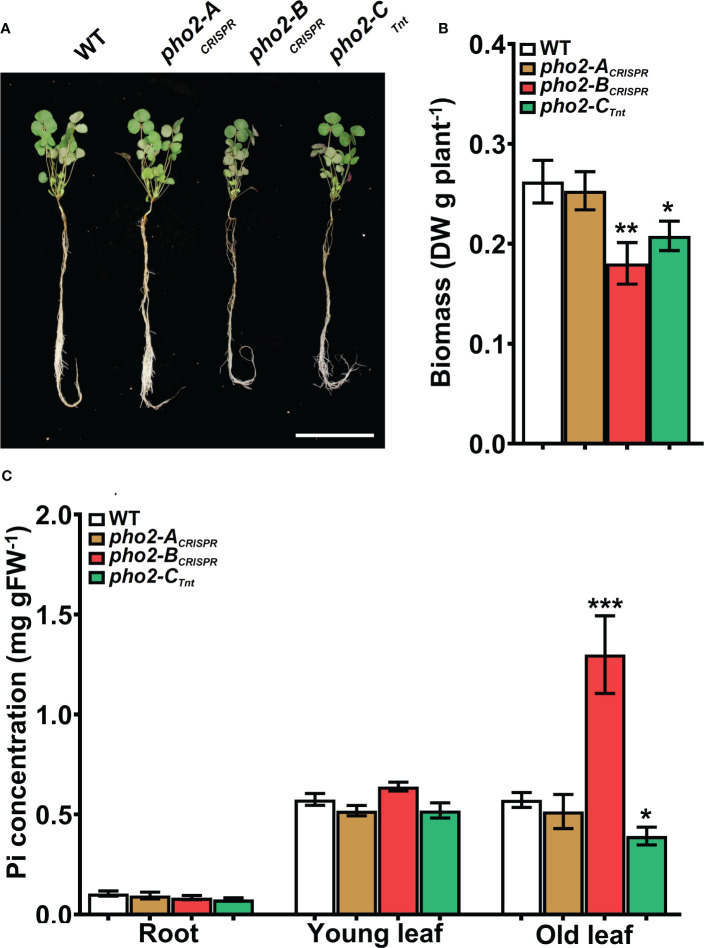
Figure 4.
Performance of the pho2 mutants under optimal nutritional conditions. (A) Representative four-week-old plants growth under optimal nutritional conditions, including 0.5 mM Pi. Scale bar = 10 cm. (B) Plant dry weight. (C) Free phosphate (Pi) concentration in roots, young and old leaves. Data shown are the mean and SEM of three independent experiments (n=5 per experiment). Asterisks indicate significant differences between the wild type and the mutants calculated using two-tailed Student’s t-tests (*p < 0.05, **p < 0.01, ***p < 0.001).

