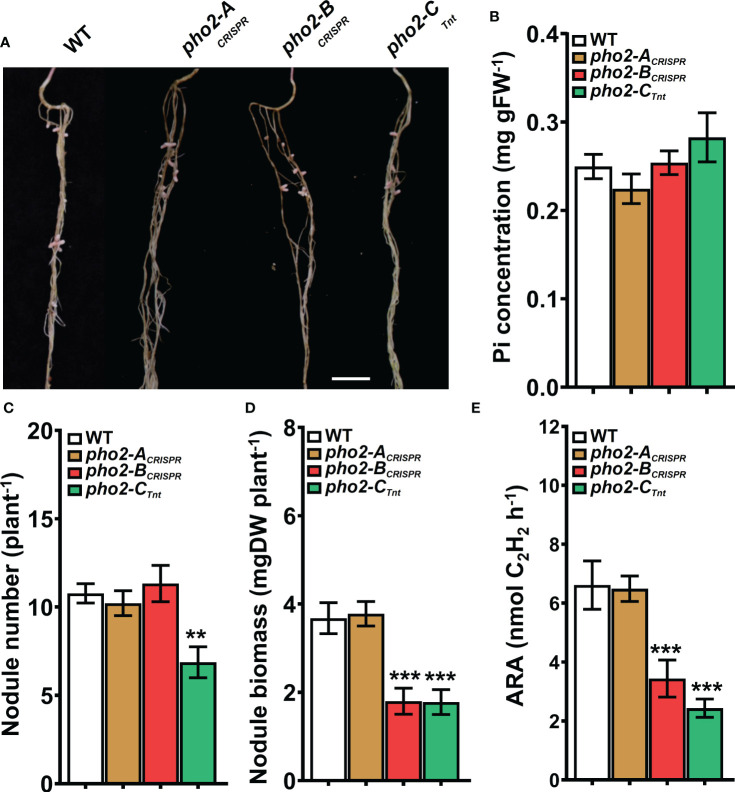
Figure 8.
Symbiotic phenotypes of the Mtpho2 mutants with reduced-P. (A) Nodulated roots at 21 dpi with S. meliloti strain Sm1021. Scale bar = 1 cm. (B) Free phosphate (Pi) concentration in nodules (C) Average nodule number. (D) Average nodule biomass. (E) Acetylene reduction activity (ARA) of whole nodulated roots. Data shown are the mean and SEM of three independent experiments (n=5/experiment). Asterisks indicate significant differences between the wild type and mutants calculated using two-tailed Student’s t-tests (*p < 0.05, **p < 0.01, ***p < 0.001).

