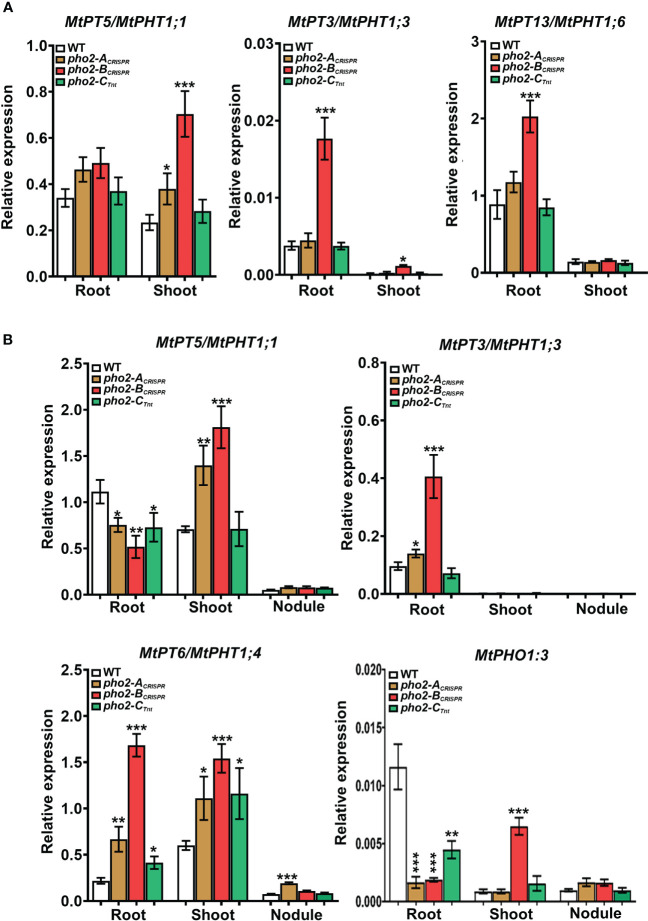
Figure 9.
Relative expression levels, quantified by qPCR, of MtPHT1-like genes in various experimental conditions and organs (A) Optimal-P. (B) Symbiotic nitrogen fixation with optimal-P. PCR primers used are included in Supplementary Table S2 . Data shown are the mean and SEM of three independent experiments. Plants were grown under the same conditions as those shown on Figures 4 – 8 . For each replica, copy numbers were normalized using the mean average of two housekeeping genes (MtPTB2 and MtPDF2); asterisks indicate significant differences between the WT and mutants in each tissue of the same condition calculated using two-tailed Student’s t-tests (*p < 0.05, **p < 0.01, ***p < 0.001). Double nomenclature (PT/PHT) due to Breuillin-Sessoms et al., 2015. Plant Cell. 27(4):1352-66.999.

