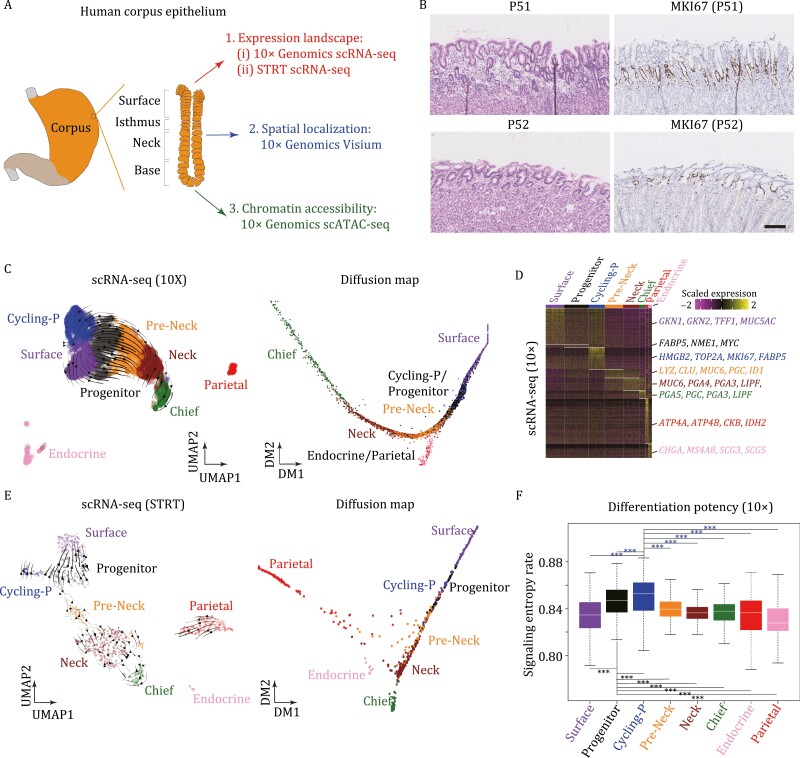
Figure 1.
Gene expression landscapes of human gastric corpus epithelium. (A) Sketch of human gastric corpus tissue sampling and multi-omics profiling. Human gastric corpus samples were biopsied and sequenced using scRNA-seq, spatial transcriptomes, and scATAC-seq techniques. (B) H&E and MKI67 immunohistochemistry staining on gastric corpus samples of P51 and P52. Scale bar: 100 μm. (C) UMAP plot (left) and diffusion map plot (right) exhibiting the identified clusters of 10× dataset in human gastric corpus. Arrows in the UMAP plot indicate the differentiation routes inferred by RNA velocity analysis. Clusters are indicated by colors. (D) Heatmap exhibiting DEGs and representative marker genes of each cluster in gastric corpus 10× dataset. The color key from purple to yellow indicates low to high expression levels, respectively. (E) UMAP plot (left) and diffusion map plot (right) exhibiting the identified clusters of STRT dataset in gastric corpus. Arrows in the UMAP plot indicate the differentiation routes inferred by RNA velocity analysis. Clusters are indicated by colors. (F) Differentiation potency inferred through SCENT for each cluster in gastric corpus 10× dataset. Significance was determined by t-tests. *P-value <0.05, ***P-value <0.001.

