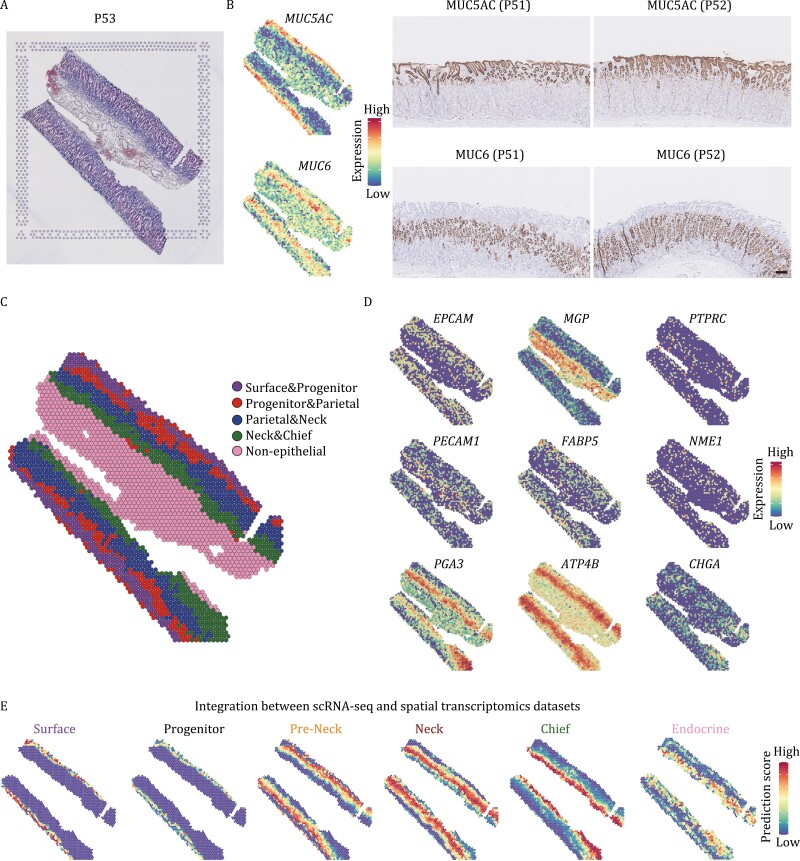
Figure 2.
Spatial transcriptomics of human gastric corpus epithelium. (A) H&E staining of human gastric corpus section used for spatial transcriptomics. (B) Validation of spatial transcriptomics by comparison of the expression pattern of MUC5AC and MUC6 in spots and immunohistochemistry staining pattern of MUC5AC and MUC6. The color key from blue to red indicates low to high expression levels, respectively. (C) Clustering result of spatial transcriptomics. Clusters are indicated by colors. (D) The expression patterns of representative marker genes in spots. (E) Integration result by transferring the scRNA-seq dataset to the spatial transcriptomics dataset.

