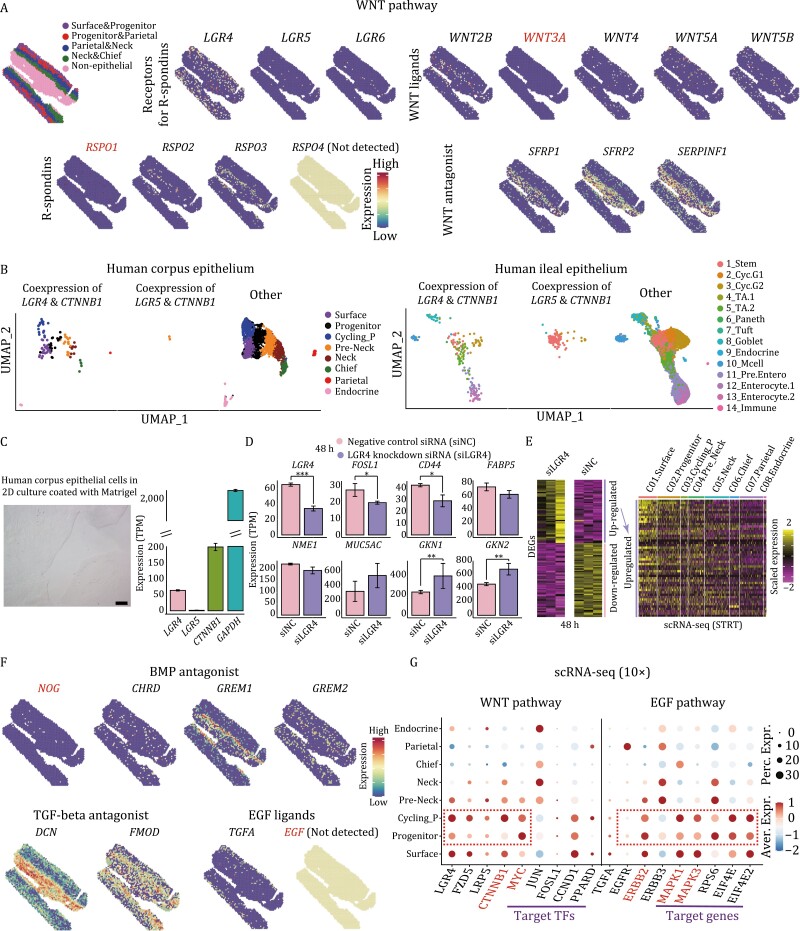
Figure 3.
Signaling pathways crucial for the homeostasis of human gastric corpus epithelium. (A) The expression patterns of WNT signaling pathway related genes in spots. The color key from blue to red indicates low to high expression levels, respectively. (B) UMAP plots exhibiting the cells coexpressing LGR4 & CTNNB1 and LGR5 & CTNNB1 in human gastric corpus epithelium (left) and human ileal epithelium (right). Cell types are indicated by colors. TA: transit-amplifying; Mcell: microfold cell. (C) Human corpus epithelial cells in 2D culture coated with Matrigel and their gene expression levels of LGR4, LGR5, and CTNNB1. (D) The expression levels of representative genes in LGR4 knockdown human corpus epithelial cells compared with those in negative control siRNA transfected ones (48 h after transfection). Significance was determined by t-tests. *P-value <0.05, ***P-value <0.001. (E) Heatmap exhibiting the DEGs of LGR4 knockdown group compared with negative control siRNA transfected group (48 h after transfection) (left). On the right is the heatmap exhibiting the upregulated DEGs in the STRT scRNA-seq dataset. The color key from purple to yellow indicates low to high expression levels, respectively. (F) The gene expression patterns of BMP, TGF-beta, and EGF signaling pathways related genes in spots. (G) Dotplot exhibiting the expression pattern of WNT and EGF signaling pathways related genes in gastric corpus 10× dataset. The color key from blue to red indicates low to high expression levels, respectively. The circle size indicates the percentage of cells expressing a certain gene.

