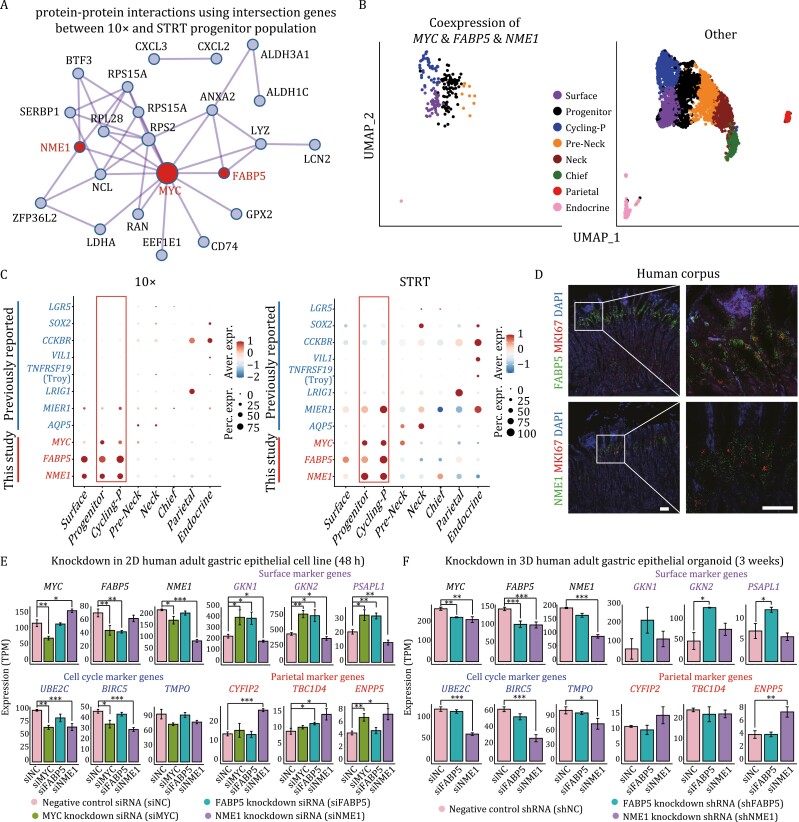
Figure 4.
Identification of gastric corpus stem/progenitor cell marker genes. (A) Candidate stem/progenitor marker genes shown in PPI network. The network was constructed by the intersection genes between 10× and STRT progenitor population. (B) UMAP plots exhibiting the cells coexpressing MYC & FABP5 & NME1 in human gastric corpus epithelium. Cell types are indicated by colors. (C) Dotplot showing the expression patterns of the three identified genes (MYC, FABP5, and NME1) and previously reported marker genes of gastric stem cells in both 10× (left) and STRT (right) datasets. The color key from blue to red indicates low to high expression levels, respectively. The circle size indicates the percentage of cells expressing a certain gene. (D) RNAscope staining for FABP5, NME1 and MKI67 on human gastric corpus samples. Scale bar: 100 μm. (E) Knockdown in 2D human adult gastric epithelial cell line. Barplots exhibiting the expression levels of representative genes in MYC, FABP5, and NME1 knockdown group compared with negative control group (48 h after transfection). Significance was determined by t-tests. *P-value <0.05, ***P-value <0.001. (F) Knockdown in 3D human adult gastric epithelial organoids. The expression levels of representative genes in FABP5 and NME1 knockdown group compared with negative control group (48 h after transfection). Significance was determined by t-tests. *P-value <0.05, ***P-value <0.001.

