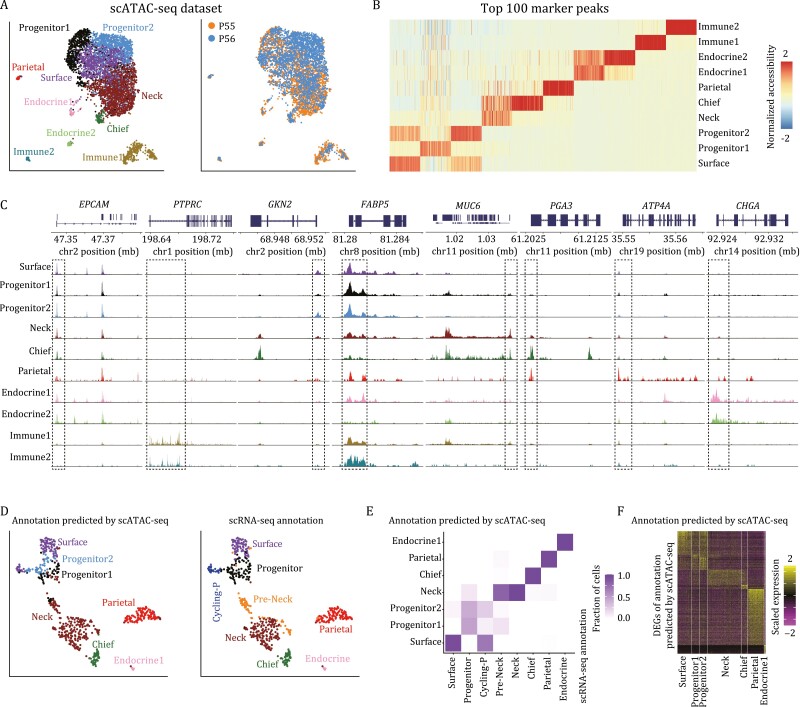
Figure 6.
Chromatin accessibility landscapes of human gastric corpus epithelium. (A) UMAP plots exhibiting the identified clusters (left) and sample information (right) of scATAC-seq dataset in human gastric corpus. Clusters and samples are indicated by colors. (B) Heatmap exhibiting the top 100 marker peaks of each cluster. The color key from blue to red indicates low to high normalized accessibility, respectively. (C) Genomic tracks exhibiting the accessibility of representative marker genes in aggregated scATAC-seq clusters. (D) UMAP plots exhibiting CCA integration result between gene activity scores of scATAC-seq and gene expression levels of scRNA-seq. The left panel is the annotation predicated by scATAC-seq, and the right panel is the original scRNA-seq clustering result. Clusters are indicated by colors. (E) Heatmap exhibiting the comparison between the annotation predicated by scATAC-seq and the original scRNA-seq clustering result. The color key from white to purple indicates low to high fraction of cells, respectively. (F) Heatmap exhibiting the DEGs of scRNA-seq dataset annotated by scATAC-seq. The color key from purple to yellow indicates low to high expression levels, respectively.

