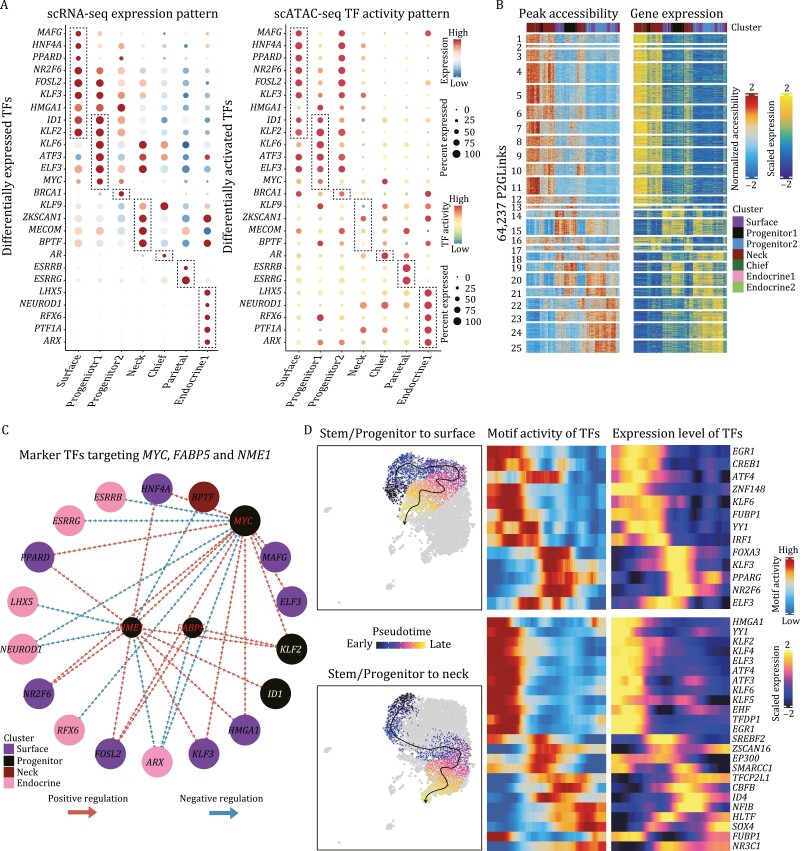
Figure 7.
Epigenetic regulatory network of human gastric corpus epithelium. (A) Dotplots exhibiting the differentially expressed TFs (left) and differentially activated TFs (right) in scRNA-seq and scATAC-seq datasets, respectively. The color key from blue/green to red indicates low to high expression levels, respectively. The circle size indicates the percentage of cells for a certain TF. (B) Heatmaps exhibiting the peak accessibility (left) and expression levels (right) of 64,237 peak-to-gene pairs. The color key from blue to red/yellow indicates low to high normalized accessibility/expression levels, respectively. (C) Regulatory network of cell type specific TFs targeting the three stem/progenitor marker genes, MYC, FABP5, and NME1. Red and blue arrows indicate positive and negative regulation, respectively. (D) Differentiation routes of corpus stem/progenitor cells to surface mucous cells (up) and neck mucous cells (bottom). On the right are the heatmaps exhibiting the TF motif activity and expression levels along the differentiation routes. The color key from blue to red/yellow indicates low to high motif activity/expression levels, respectively.

