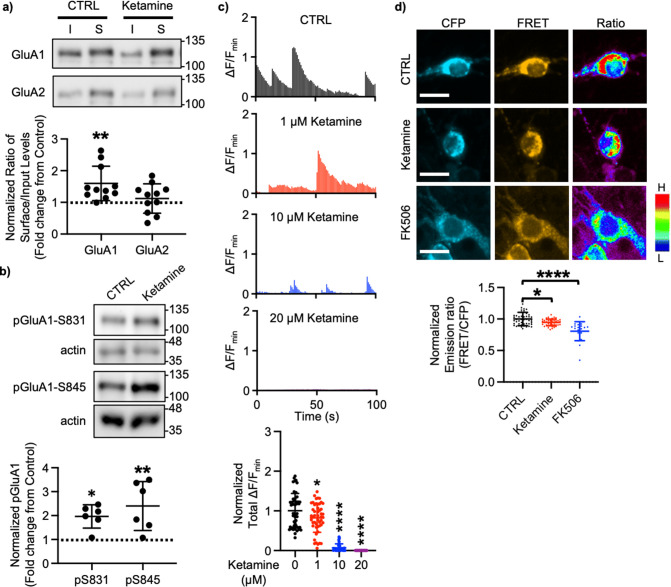
Figure 1. Ketamine treatment selectively increases GluA1-containing AMPAR surface expression by decreasing calcineurin activity in cultured mouse hippocampal neurons.
(a) Representative immunoblots of input (I) and surface (S) levels in control (CTRL) and ketamine-treated neurons. Summary bar graphs of normalized surface GluA1 and GluA2 levels in each condition (n=11 immunoblots from 4 independent cultures, **p<0.01, the Kruskal-Wallis test with the Dunn’s test). (b) Representative immunoblots of pGluA1 levels in control (CTRL) and ketamine-treated neurons. Summary graphs of normalized GluA1 phosphorylation levels in each condition (n=6 immunoblots from three independent cultures, *p<0.05 and **p<0.01, the Kruskal-Wallis test with the Dunn’s test). (c) Representative traces of GCaMP7s signals in excitatory cells and summary data of normalized total Ca2+ activity in each condition (n=number of neurons from two independent cultures, CTRL = 46, 1 μM Ketamine = 49, 10 μM Ketamine = 27, and 20 μM Ketamine = 26, *p<0.05 and ****p<0.0001, One-way ANOVA with the Tukey test). (d) Representative images of a CFP channel, a FRET channel, and a pseudocolored emission ratio (Y/C) in each condition [blue (L), low emission ratio; red (H), high emission ratio]. Scale bar is 10 µm. A summary graph showing average of emission ratio (Y/C) in each condition (n= number of cells, CTRL = 47, ketamine = 44, and FK506=20 from two independent cultures; *p<0.05 and ****p<0.0001; One-way ANOVA with the Tukey test). A scale bar indicates 10 μm. The position of molecular mass markers (kDa) is shown on the right of the blots. Mean ± SD.

