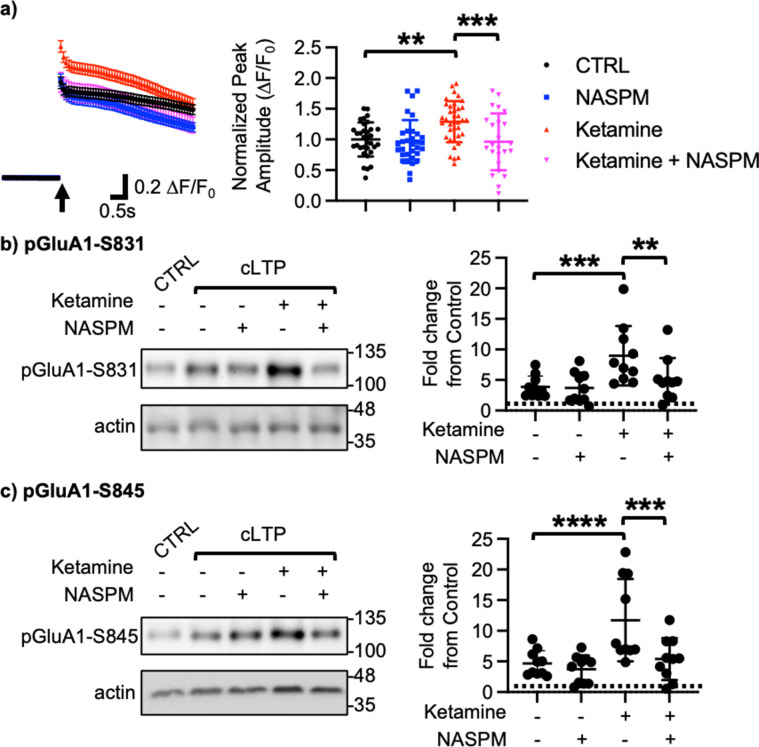
Figure 2. Ketamine treatment induces CP-AMPAR expression to enhance glutamatergic activity and glutamate receptor plasticity in cultured mouse hippocampal neurons.
(a) Average traces of virally expressed GCaMP7s signals, and summary data of normalized peak amplitude in each condition (n=number of neurons, CTRL = 33, NASPM = 32, Ketamine = 37, and Ketamine +NASPM = 24 from two independent cultures; **p<0.01 and ***p<0.001; Two-way ANOVA with the Tukey test). An arrow indicates photostimulation. Representative immunoblots and quantitative analysis of (b) pGluA1-S831 and (c) pGluA1-S845 levels in each condition (n=10 immunoblots from five independent cultures, **p<0.01, ***p<0.001, and ****p<0.0001, the Kruskal-Wallis test with the Dunn’s test). The position of molecular mass markers (kDa) is shown on the right of the blots. Mean ± SD.

