. 2023 Jun 13;12:e85009. doi: 10.7554/eLife.85009

Figure 2. CD8+ T-cell profiles in convalescent coronavirus disease-19 (COVID-19) patients at 3 months post admission.

(A–D) Percentage of CD8+ T-cells within the CD3+ gate (A), absolute number of CD8+ T-cells (cells/mm3) (B), and percentages of CD8+ T-cells co-expressing the activation markers HLA-DR/CD38 (C) or granzyme B (D, shown as mean fluorescence intensity [MFI]) are shown in mild, moderate, and severe patients. (E) Percentages of naïve (CCR7+ CD45RA+), T central memory (TCM, CCR7+ CD45RA-), T effector memory (TEM, CCR7- CD45RA-), and T effector memory RA re-expressing (TEMRA, CCR7- CD45RA+) CD8+ T-cells in patients with mild, moderate, and severe disease. (F) Flow cytometry plot with a representative staining from a mild, moderate, and severe patient (overlaid and shown respectively in blue, black, and red) of HLA-DR and CD38 expression in CD8+ TEM cells. (G) Percentages of activated HLA-DR+ CD38+ CD8+ T-cells within naïve, TCM, TEM, and TEMRA cells. (H) Flow cytometry plot with a representative staining from a mild, moderate, and severe patient of HLA-DR and granzyme B (GrzmB) expression in CD8+ TEM cells. (I) Percentages of proliferating HLA-DR+ GrzmB+ CD8+ T-cells within naïve, TCM, TEM, and TEMRA cells. (J) Unsupervised uniform manifold approximation and projection (UMAP) analysis showing the FlowSOM clusters in mild (N=17), moderate (N=25), and severe (N=14) patients. Plots are gated on CD8+ T-cells. (K) Heatmap with MFI levels for each analysed marker within the FlowSOM populations. (L) Summary of percentage of CD8+ T-cells within the indicated FlowSOM populations in mild, moderate, and severe patients. Data in the graphs are shown as mean ± SEM. Statistics were calculated by one-way ANOVA (Kruskal-Wallis test) with Dunn’s correction for multiple testing.

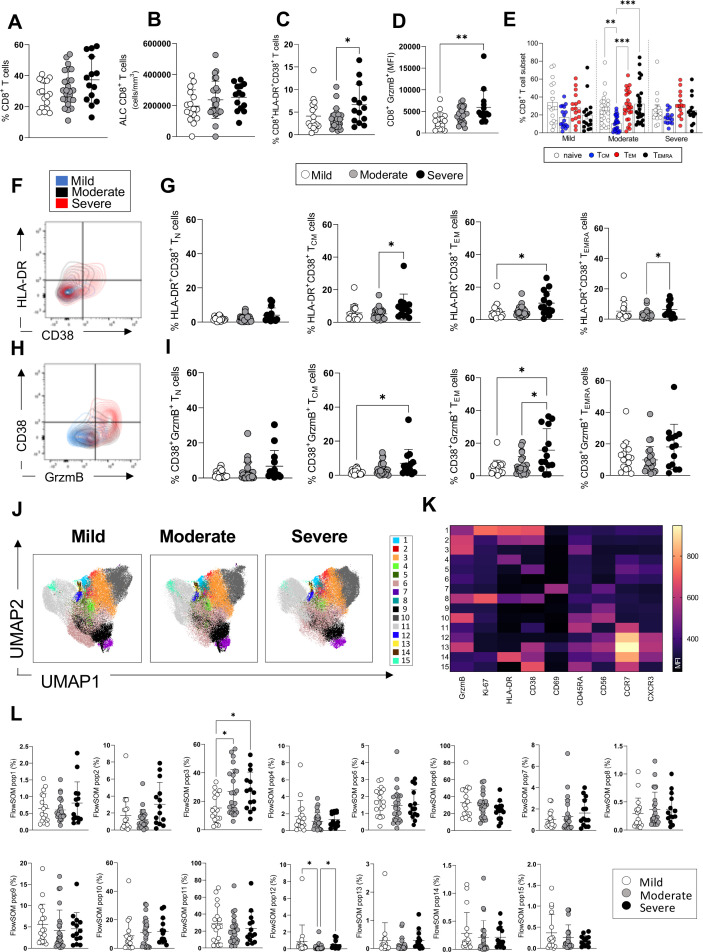
Figure 2.

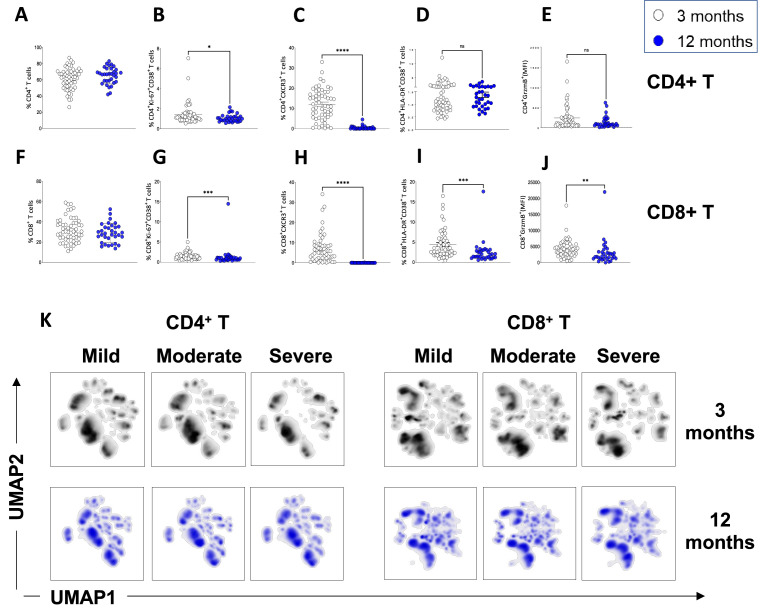
Figure 2—figure supplement 1. Resolution of T-cell activation at 12 months.

Figure 2—figure supplement 1.

(A–E) CD4+ T-cells in convalescent coronavirus disease-19 (COVID-19) patients at 3 and 12 months. Shown are the percentages of CD4+ T-cells within the CD3+ gate (A) and the percentages of CD4+ T-cells that are Ki67+ CD38+ (B), CXCR3+ (C), HLA-DR+CD38+ (D) and granzyme B+ (shown as mean fluorescence intensity [MFI]) (E).(FJ) CD8+ T-cells in convalescent COVID-19 patients at 3 and 12 months. Shown are the percentages of CD8+ T-cells within the CD3+ gate (F) and the percentages of CD8+ T-cells that are Ki67+ CD38+ (G), CXCR3+ (H), HLA-DR+CD38+ (I), and granzyme B+ (shown as MFI) (J). (K) Unsupervised uniform manifold approximation and projection (UMAP) analysis showing the density plot of cell distribution in mild (N=17), moderate (N=25), and severe (N=14) patients at 3 months and in matched mild (N=8), moderate (N=17), and severe (N=8) patients at 12 months post infection. Data in A–J are shown as mean ± SEM. Statistics in A–J were calculated by Mann-Whitney t-test.
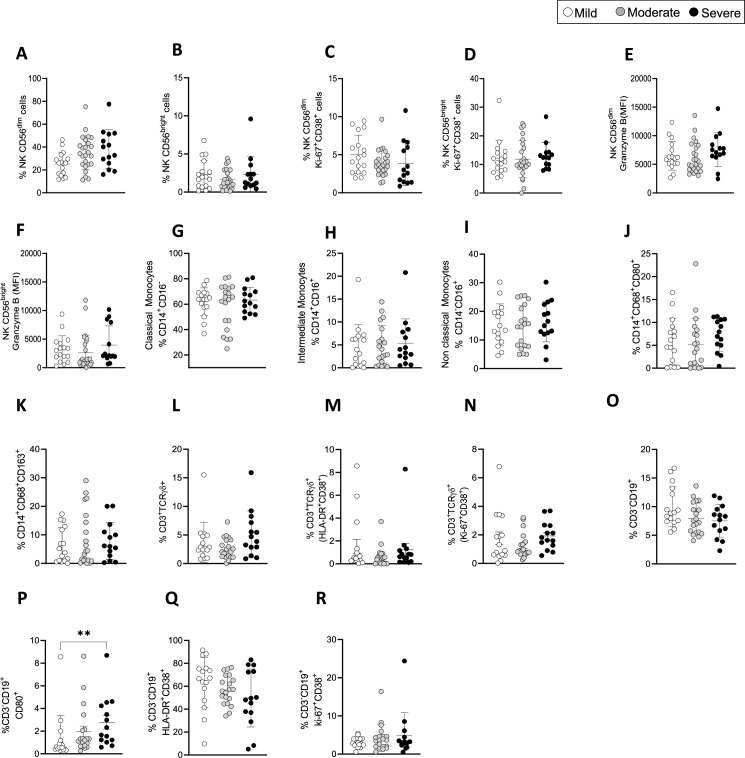
Figure 2—figure supplement 2. Immune cell populations in coronavirus disease-19 (COVID-19) patients at 3 months post admission.

Figure 2—figure supplement 2.

(A–F) Shown are the percentages of CD56dim (A), CD56bright NK cells (B), Ki67+CD38+ CD56dim (C), and Ki67+CD38+CD56bright NK cells (D). Granzyme B expression on CD56dim (E) and CD56bright (F) NK cells is shown as mean florescence intensity (MFI). (G–K) Shown are the percentages of classical (G: CD14+CD16-), intermediate (H: CD14+CD16+), and non-classical (I: CD14-CD16+) monocytes, activated CD14+CD80+CD86+ (J) and CD14+CD86+CD163+ cells (K). (LN) TCR-γδ T-cells: frequencies of TCR-γδ T-cells (L), activated HLA-DR+CD38+ (M), and activated/proliferating Ki67+CD38+ TCR-γδ T-cells (N).(O–R) Shown are the percentages of CD3-CD19+ B cells (O), activated CD80+ (P), and HLA-DR+CD38+ B cells (Q) and proliferating Ki67+CD38+ B cells (R). Data are shown as mean ± SD in patients with mild (N=16), moderate (N=21) and severe (N=14) disease. Statistics were by calculated one-way ANOVA test (Kruskal-Wallis test) with Dunn’s correction for multiple testing.