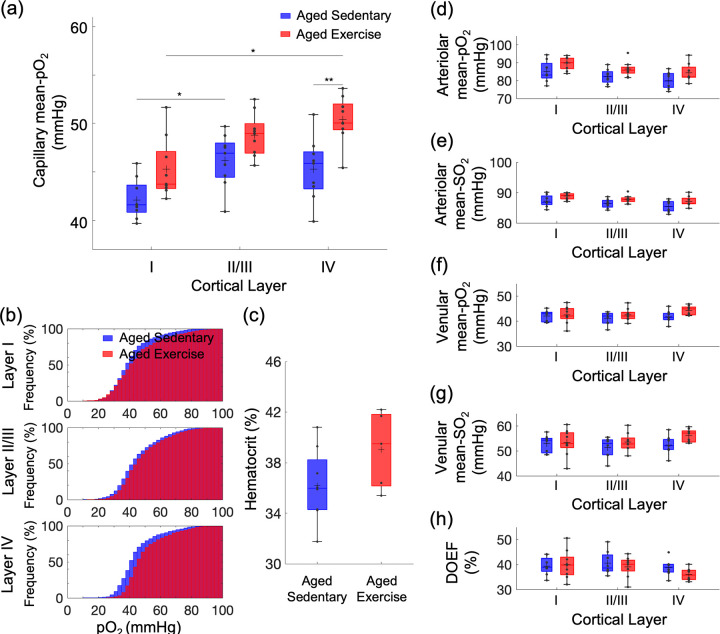
Figure 2. Exercise-induced changes in microvascular pO2 across cortical layers in old mice.
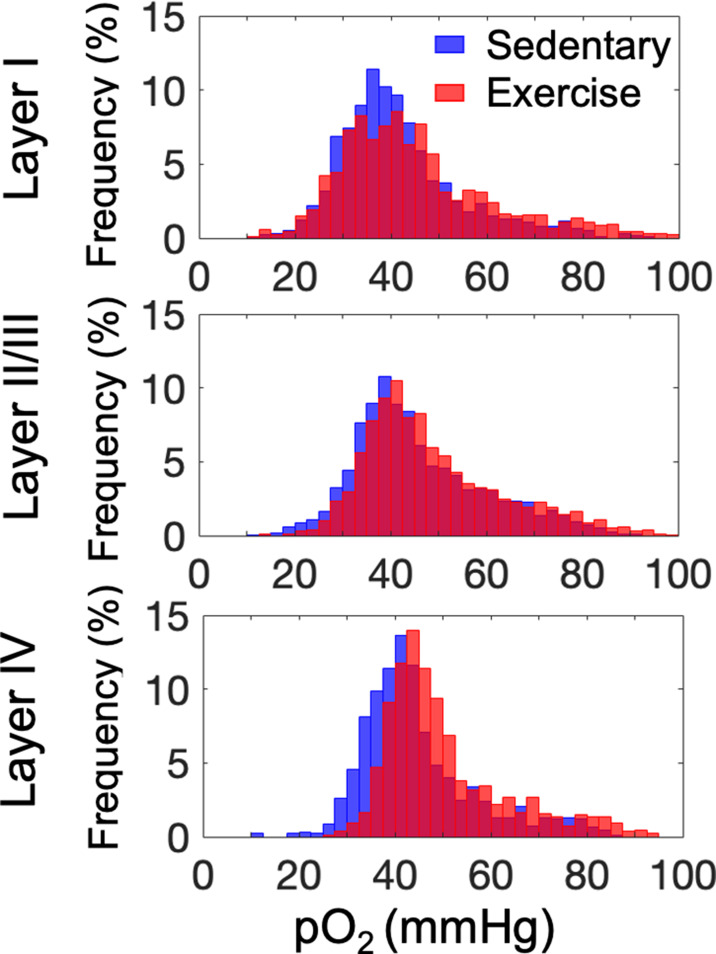
(a) Capillary mean pO2 across cortical layers in aged sedentary controls and exercising mice. (b) Cumulative histograms of capillary pO2 in layers I, II/III, and IV. (c) The mean Hct levels from aged sedentary (n = 8) and aged exercise groups (n = 5). (d, e) Intravascular pO2 and SO2 in the diving arterioles across cortical layers I–IV in aged sedentary (blue boxplots) and aged exercise (red boxplots) groups, respectively. (f, g) Intravascular pO2 and SO2 in the surfacing venules across cortical layers I–IV in aged sedentary (blue boxplots) and aged exercise (red boxplots) groups, respectively. (h) Depth-dependent OEF in aged sedentary (blue boxplots) and aged exercise (red boxplots) groups. The analysis in (a) and (b) was made with 1224, 2601, and 922 capillaries across n = 9 mice in aged sedentary group and 1334, 2840, and 1078 capillaries across n = 9 mice in aged exercise group in cortical layers I, II/III, and IV, respectively. The analysis in (d–h) was made with 13 arterioles and 12 venules from n = 9 mice in aged sedentary group and 14 arterioles and 12 venules from n = 9 mice in aged exercise group. Statistical analysis was carried out using two-way analysis of variance (ANOVA) with post hoc Tukey’s in (a) and (d–h) and Student’s t-test in (f). *p < 0.05; **p < 0.01. Additional details on boxplots and exclusions are provided in the Supplementary document.


