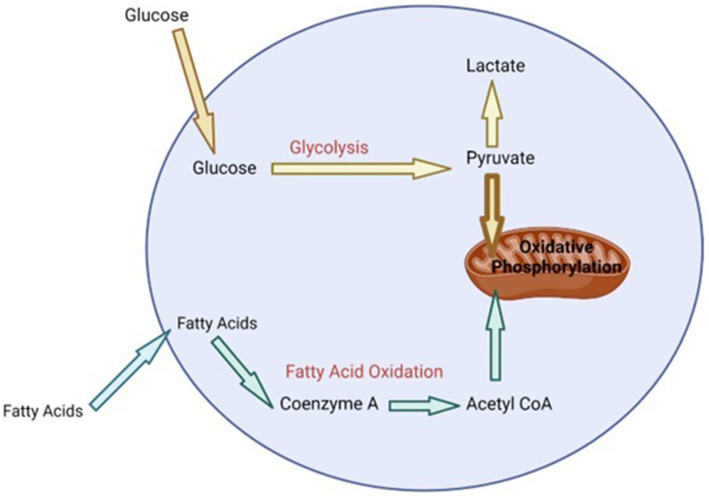
Figure 1.
Summary of cell metabolism at homeostasis [adapted from Loftus and Finlay (55) and (64)]. Bolded text represents high levels of particular metabolic processes (oxidative phosphorylation). Bolded arrow indicates majority of the metabolite (pyruvate) transferred to mitochondria for oxidative phosphorylation. Non-bolded text and arrows represents lower concentration of metabolites and low level of metabolic processes.

