FIGURE 3.

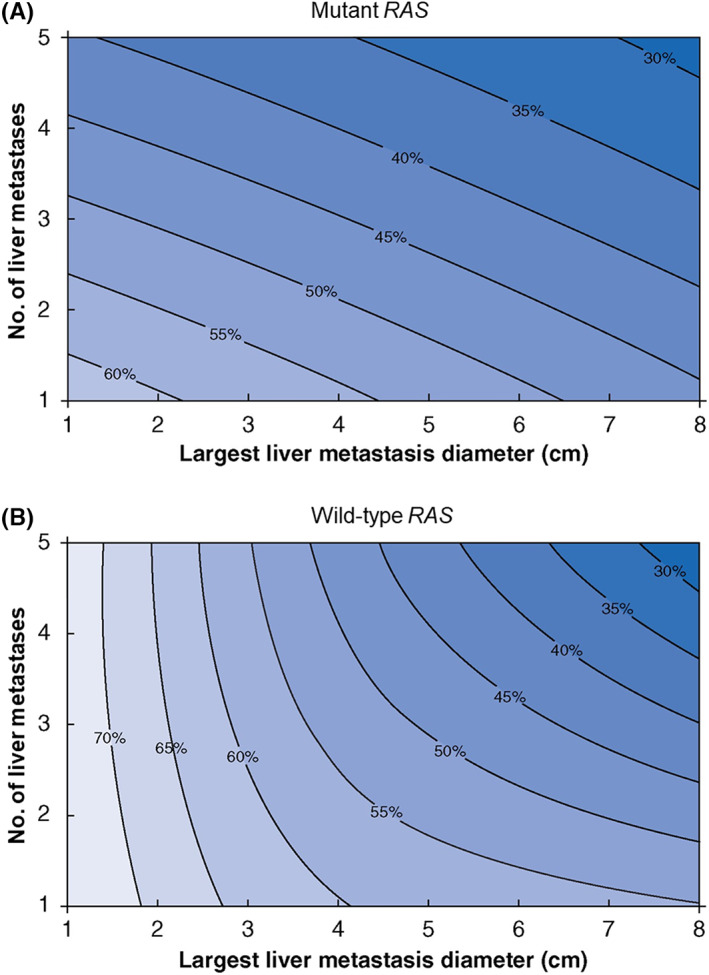
Contour plot of 5‐y overall survival probability according to the largest diameter and number of colorectal liver metastases for patients with: (A) mutant RAS and (B) wildtype RAS. (Adapted from Kawaguchi et al 1 with permission.)

Contour plot of 5‐y overall survival probability according to the largest diameter and number of colorectal liver metastases for patients with: (A) mutant RAS and (B) wildtype RAS. (Adapted from Kawaguchi et al 1 with permission.)