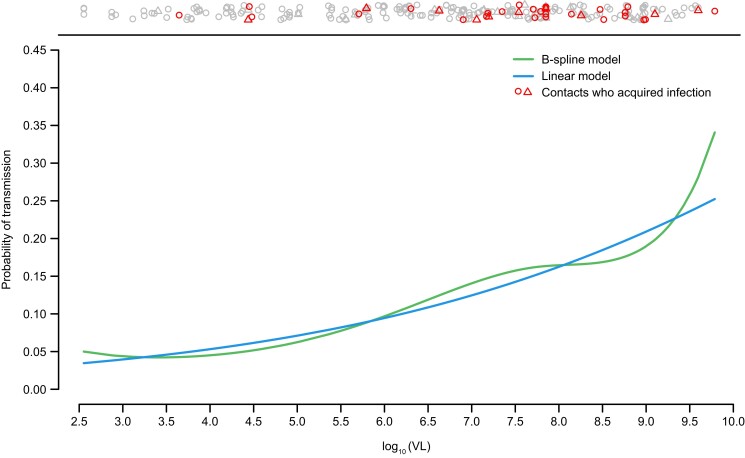
Figure 3.
Relationship between viral load (VL) in the index case and risk of transmission to susceptible contact under linear and B-spline models. Markers at the top of the plot indicate transmission outcomes in the contacts at their source's VL. Contacts may be represented multiple times depending on the number of sources in the household. Those contacts who acquired infection are indicated in red with the number of sources indicated by the shape (circle = 1; triangle = 2; + = 3).

