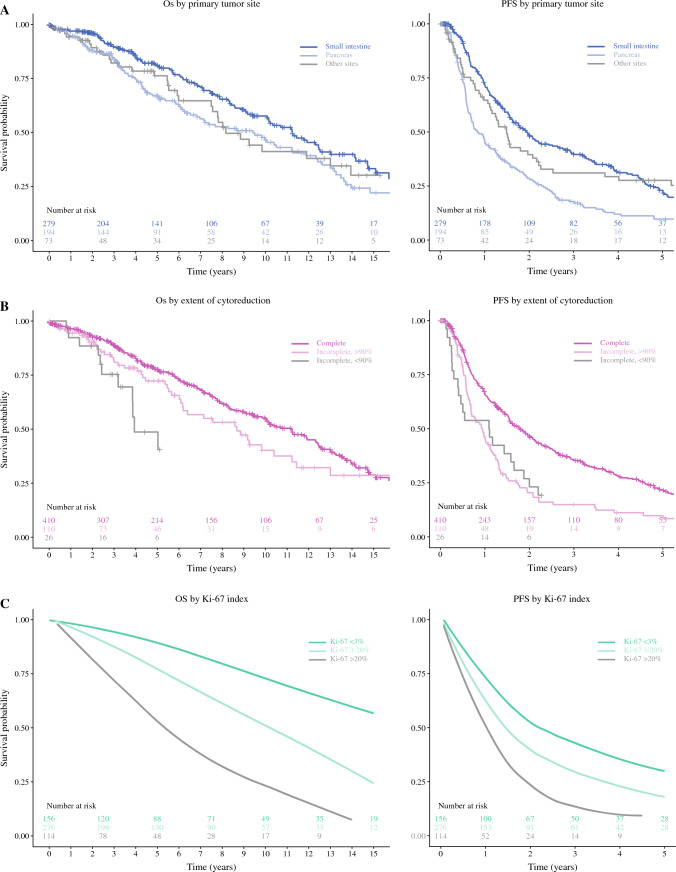
Fig. 3.
Overall survival (OS) and progression-free survival (PFS) from hepatectomy. A Stratification of OS (p = 0.038) and PFS (p < 0.001) by primary tumor site. B Stratification of OS (p = 0.06) and PFS (p < 0.001) by extent of cytoreduction. C Stratification of OS (p < 0.001) and PFS (p < 0.001) by Ki-67 index. A loess smoother was used to generate summary survival curves for each of the Ki-67 subgroups after multiple imputation. Survival curves are truncated when fewer than five patients remain at risk (A–B) or after the last documented event (C)

