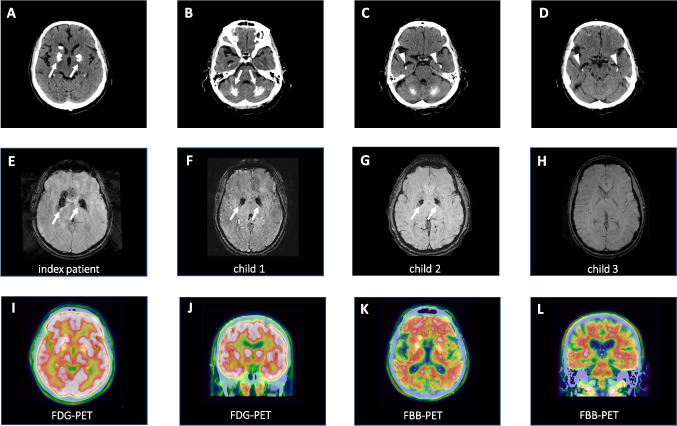
Fig. 1.
Axial cerebral CT and susceptibility-weighted MR imaging of the index patient (A–E) shows extensive calcifications of bilateral basal ganglia (in pallidum and caudate nucleus) as well as in both cerebellar hemispheres (arrows) and bilateral hippocampus (arrowheads). Susceptibility-weighted MR imaging of the index patient’s children (F–H) shows symmetrical calcifications of the basal ganglia (arrows) in both child 1 and child 2. Child 3 shows no calcifications. Axial and coronal FDG-PET/CT (I, J) of the index patient demonstrates areas of slightly reduced glucose metabolism in parietal and mesiotemporal cortex. FBB-PET/CT (K, L) study in axial and coronal sections shows widespread β-amyloid deposits in the frontal and temporal cortex but also in the parietal cortex. Red/light red indicates high values; green/blue indicates low values

