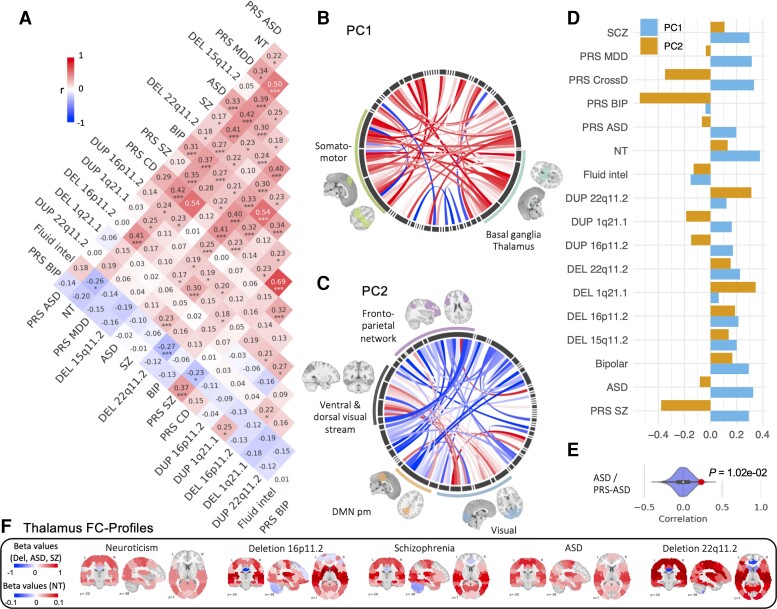
Figure 2.
Atlas of FC relationships across psychiatric conditions, genetic risks and traits. (A) Pearson correlation between 17 FC profiles (2080 beta values from CWAS). Stars represent significant correlations (*P < 0.05, **P < 0.005, ***q FDR). (B–D) PCA conducted on the 17 FC profiles: (B and C) Loadings of functional connections on PC1 (B) and PC2 (C) (overconnectivity in red, underconnectivity in blue). Each chord diagram shows the top 5% of connections’ loadings. All 64 seed regions are represented in the black inner circle. Seed regions are grouped into functional networks. The width of the seed region in the black inner circle corresponds to the contribution of regions to the PC. Dimension 1 was dominated by overconnectivity of the thalamus, basal ganglia and the somatomotor network. Dimension 2 was dominated by altered connectivity between the visual network and the posterior-medial default mode network. (D) Loadings of conditions and traits on PC1 (blue) and PC2 (orange) explaining, respectively, 24 and 10% of the connectome-wide variance across FC profiles. (E) Density plots show examples of null distributions of correlations used to determine significance. FC profiles of ASD and PGS ASD have the lowest correlation that survives FDR. (F) Brain maps represent thalamic FC profiles (64 beta values for each connection between the thalamus and all other functional regions). Red shows overconnectivity and blue underconnectivity. The colour scale represents the beta value (z-score). MDD = major depressive disorder; CD = Cross-disorder; NT = Neuroticism; fluid intel = fluid intelligence; Del = deletion; Dup = duplication; DMN pm = posteromedial default mode network.

