Figure 7.
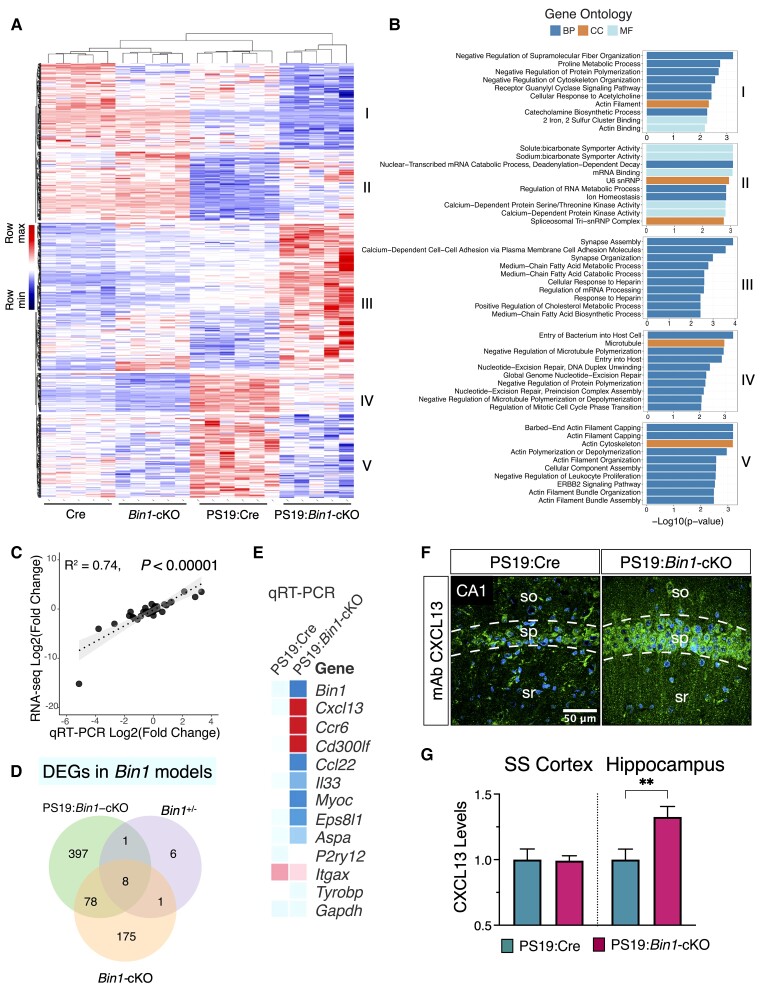
Transcriptomic profiling of Bin1-cKO mice identifies CNS cell-type-specific DEGs. (A and B) Heat map of the upregulated or downregulated DEGs from a combined analysis of the RNA-seq data from Bin1-cKO with- and without tau pathology mice. Hierarchical clustering identified five clusters of genes in this dataset of 928 DEGs (Padj value <0.05). (C) Validation of the RNA-seq by the real-time qPCR revealed a tight correlation (R2 = 0.74, P < 0.0001) between the two methods for 42 selected DEGs. (D) Venn diagram of DEGs (Padj <0.05) identified in each cohort. The 16 DEGs in Bin1+/− mice were identified in a previous study.51 In Bin1-cKO mice (no tau pathology), 262 genes were identified, whereas in PS19:Bin1-cKO mice, 484 genes were identified. Eight common DEGs were found in all three datasets. 397 DEGs were unique to Bin1-cKO mice in the context of tau pathology. (E) qRT-qPCR results of immune response DEGs are represented as a heat map. (F) Immunostaining shows a higher neuronal expression of CXCL13 in the hippocampus of PS19:Bin1-cKO mice. (G) Quantification of CXCL13 immunostaining in the hippocampus and Som sen CTX revealed significant differences in the hippocampus (PS19:Cre, n = 7 and PS19:Bin1-cKO, n = 7). **P < 0.01.

