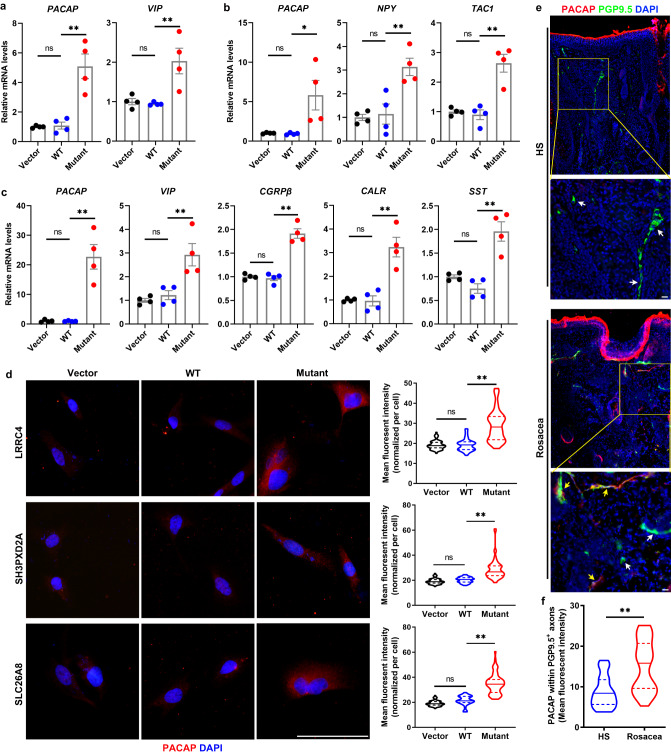
Fig. 4. Mutation of LRRC4/SH3PXD2A/SLC26A8 increases vasoactive neuropeptides in human neural cells.
a–c The relative mRNA expression levels of PACAP, VIP, NPY, CGRPβ, TAC1, CALR, and SST in human neural cells transfected respectively with LRRC4 (a), SH3PXD2A (b), and SLC26A8 (c) mutant/wild-type (WT)/Control vector plasmids (n = 4 biologically independent experiments). a PACAP: Mutant vs WT, P = 0.0009; WT vs Vector, P = 0.9992, VIP: Mutant vs WT, P = 0.0094; WT vs Vector, P = 0.9961. b PACAP: Mutant vs WT, P = 0.0324; WT vs Vector, P > 0.9999, NPY: Mutant vs WT, P = 0.0064; WT vs Vector, P = 0.9874, TAC1: Mutant vs WT, P = 0.0005; WT vs Vector, P = 0.9795. c PACAP: Mutant vs WT, P = 0.0004; WT vs Vector, P > 0.9999, VIP: Mutant vs WT, P = 0.0086; WT vs Vector, P = 0.9417, CGRPβ: Mutant vs WT, P < 0.0001; WT vs Vector, P = 0.9866, CALR: Mutant vs WT, P = 0.0006; WT vs Vector, P = 0.9996, SST: Mutant vs WT, P = 0.0004; WT vs Vector, P = 0.5298. d Immunostaining of PACAP in human neural cells transfected respectively with LRRC4, SH3PXD2A, and SLC26A8 mutant/WT/control vector plasmids. Right panels, the quantification of mean fluorescent intensity for PACAP in the corresponding groups. n = 42–71 cells from three independent experiments. LRRC4: Mutant vs WT, P < 0.0001; WT vs Vector, P = 0.9976, SH3PXD2A: Mutant vs WT, P < 0.0001; WT vs Vector, P = 0.5517, SLC26A8: Mutant vs WT, P < 0.0001; WT vs Vector, P = 0.0612. e Co-immunostaining of PACAP and PGP9.5 on skin sections from rosacea patients (rosacea, n = 6) and healthy individuals (HS, n = 5). Higher-magnified images of yellow boxed areas are shown below the lower-magnified images for each group. Scale bar, 50 μm. Yellow arrowheads indicate PGP9.5 positive neuron axon with strong co-immunostaining signals of PACAP; White arrowheads indicate PGP9.5 positive neuron axon with low or no immunostaining signals of PACAP. f Quantification of mean fluorescent intensity for PACAP in PGP9.5 positive neuron fibers (n = 25 for HS; n = 35 for rosacea). P < 0.0001. DAPI staining (blue) indicates nuclear localization. Scale bar, 50 μm. All results are representative of at least three independent experiments. Data represent the mean ± SEM. *P < 0.05, **P < 0.01. ns indicates no significance. One-way ANOVA with Bonferroni’s post hoc test (a–d) or two-tailed unpaired Student’s t test (f) was used.

