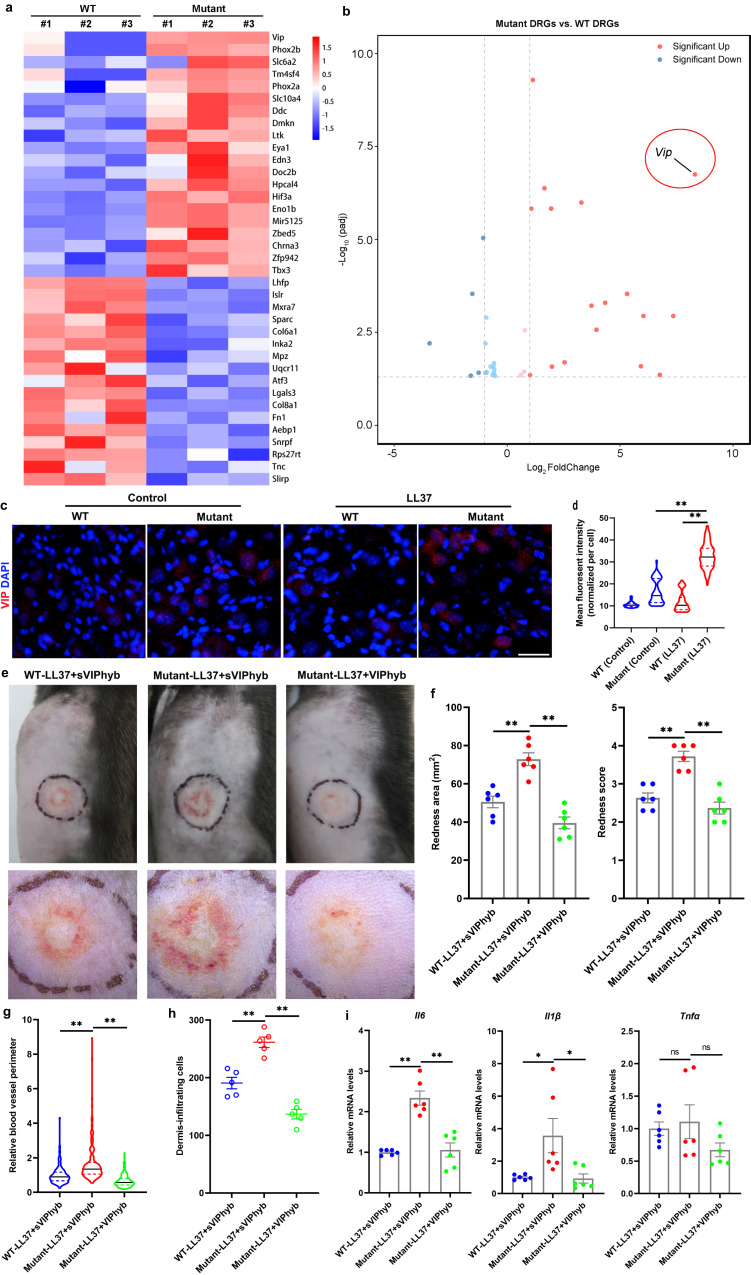
Fig. 6. Blockade of VIP signaling alleviates rosacea-like phenotypes in mice harboring Lrrc4 mutation.
a Heatmap of differentially regulated genes in DRGs from mutant and WT mice both injected with LL37 determined by RNA-sequencing (n = 3 independent biological samples for each group). Blue color denotes low FPKM expression; red, high FPKM expression. b Volcano plot of differentially regulated genes in DRGs from mutant and WT mice both injected with LL37 (n = 3 mice for each group). The red dots show the significantly upregulated genes; blue dots, significantly downregulated genes (P < 0.05). Vip is highlighted with red circle. c Immunostaining of VIP on sections of DRGs from WT and mutant mice treated with LL37 or control vehicle. Scale bar, 50 μm. d Quantification of mean fluorescent intensity for VIP in each neural cell in DRGs (n = 100 cells from three independent mice for each group). Mutant (LL37) vs WT (LL37), P < 0.0001; Mutant (LL37) vs Mutant (Control), P < 0.0001. e The back skins of LL37-administered WT and L385P mutant mice intradermally injected with VIPhyb or scrambled VIPhyp peptides (sVIPhyp). Images were taken 48 h after the first LL37 injection. Below panels, magnified images of black dotted circle areas. f The severity of the rosacea-like features after first LL37 injection for 48 h, was evaluated with the redness area and score (n = 6 mice for each group). Redness area: Mutant-LL37+sVIPhyb vs WT-LL37+sVIPhyb, P = 0.0005; Mutant-LL37+VIPhyb vs Mutant-LL37+sVIPhyb, P < 0.0001. Redness score: Mutant-LL37+sVIPhyb vs WT-LL37+sVIPhyb, P = 0.0002; Mutant-LL37+VIPhyb vs Mutant-LL37+sVIPhyb, P < 0.0001. g Quantification of relative blood vessel perimeter in the corresponding groups presented with violin plot. h Dermal infiltrating cells were quantified (n = 5 mice for each group). Mutant-LL37+sVIPhyb vs WT-LL37+sVIPhyb, P = 0.0004; Mutant-LL37+VIPhyb vs Mutant-LL37+sVIPhyb, P < 0.0001. i The relative mRNA levels of Il6, Il1β, and Tnfα in lesional skins from LL37-treated WT and Lrrc4 mutant mice intradermally injected with VIPhyb or sVIPhyp (n = 6 mice for each group). Data represent the mean ± SEM. *P < 0.05, **P < 0.01. ns indicates no significance. One-way ANOVA with Bonferroni’s post hoc test was used.

