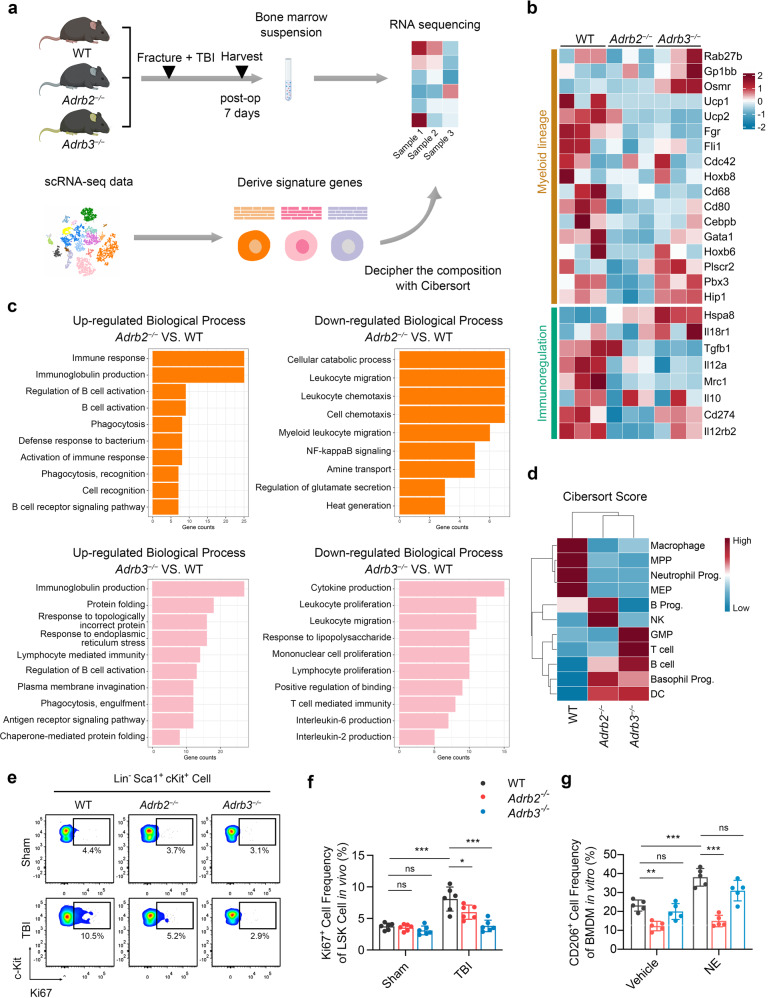
Fig. 7.
β3 signaling promote HSC proliferation in vivo, while β2 signaling is required for immunoregulation. a Schematic graph of the study of decipher the fraction of each cell populations in bone marrow. The bone marrow cells from WT, Adrb2−/−, and Adrb3−/− mice were obtained 7 days after fracture and TBI operation. The signature genes of each cell populations are derived from single-cell RNA sequencing data and are used as reference data to decipher the fraction of cell population in WT, Adrb2−/−, and Adrb3−/− mice. b Heatmap of selective gene sets focusing on those reported to be differentially expressed in myeloid cells and immunoregulatory cells. Red represents high expression; blue represents low expression. c Bar plot showing the enriched Biological Process enrichment of differentially expressed genes among WT, Adrb2−/−, and Adrb3−/− mice. d The fraction scores of each hematopoietic lineage population calculated by Cibersort algorithm. Red represents high score; blue represents low score. e, f Representative images of flow cytometry and quantitative analysis of proliferative LSKs (Lin− Sca-1+ c-Kit+ Ki67+ cells) isolated from bone marrow of 4-month-old male WT, Adrb2−/−, and Adrb3−/− mice at 7th day post operation. g Quantitative analysis of CD206+ bone marrow-derived macrophages (BMDM) isolated from WT, Adrb2−/−, and Adrb3−/− mice; the BMDM were treated with vehicle or NE at the presence of IL-4. All data are presented as means ± standard error of the mean (SEM). *P < 0.05, **P < 0.01, and ***P < 0.001, ns: not significant. Statistical significance was determined by two-way ANOVA

