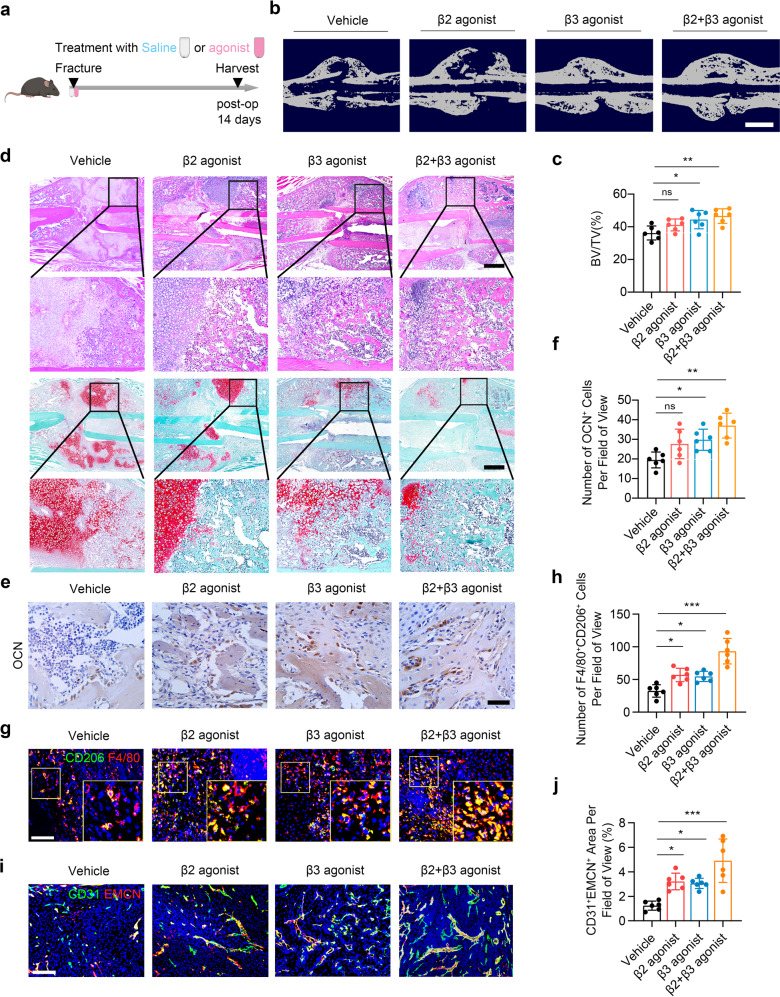
Fig. 8.
β2-AR and β3-AR agonists synergistically accelerate fracture healing. a Schematic graph of the study of β2-AR and β3-AR agonists administration. b, c Representative μCT images and quantitative analysis of BV/TV of fractured femurs from 4-month-old mice treated with β2-AR agonist, β3-AR agonist, or β2-AR agonist + β3-AR agonist. Scale bar: 2 mm. d Representative HE and SO/FG staining images in the callus area from 4-month-old mice treated with β2-AR agonist, β3-AR agonist, or β2-AR agonist + β3-AR agonist. Scale bar: 800 μm. e, f Representative IF staining images and quantitative analysis of M2 macrophages in the callus area from 4-month-old mice treated with β2-AR agonist, β3-AR agonist, or β2-AR agonist + β3-AR agonist. g, h Representative immunohistochemical (IHC) staining and quantitative analysis of OCN+ cells in the callus from 4-month-old mice treated with β2-AR agonist, β3-AR agonist, or β2-AR agonist + β3-AR agonist. Scale bar: 50 μm. i, j Representative IF staining images and quantitative analysis of type H vessels in the callus from 4-month-old mice treated with β2-AR agonist, β3-AR agonist, or β2-AR agonist + β3-AR agonist. Scale bar: 200 μm. All data are presented as means ± standard error of the mean (SEM). *P < 0.05, **P < 0.01 and ***P < 0.001, ns: not significant. Statistical significance was determined by one-way ANOVA

