Figure 1.

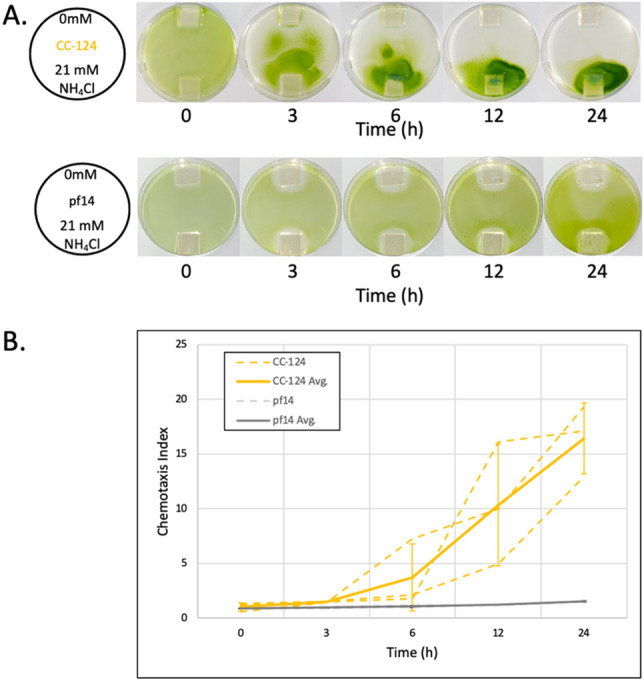
Petri dish assay and quantification for Chlamydomonas ammonium chemotaxis. (A) Photos show the directed cellular migration of a population of Chlamydomonas CC-124 over 24 h compared to the immobilized/paralyzed strain (pf14). Agarose blocks containing 0 mM and 21 mM NH4Cl were placed on the opposite sides (top and bottom, respectively, in the photos) in a Petri dish (diameter 100 mm). (B) Chemotactic Index (CI) was determined at 0, 3, 6, 12, and 24 h time points. Grey dotted lines connect the CI values at each time point. The results of three independent experiments for CC-124 and pf14 were shown (orange and dark grey dashed lines, respectively). The solid orange line connects the average CI value of CC-124 at each time point of the three independent experiments (CC-124 Avg.). The dark grey solid line connects the average CI values of pf14 at each time point of the three independent experiments (pf14 Avg.). Error bars at each time point indicate the standard deviation of the three experiments in CC-124 and pf14, respectively.
