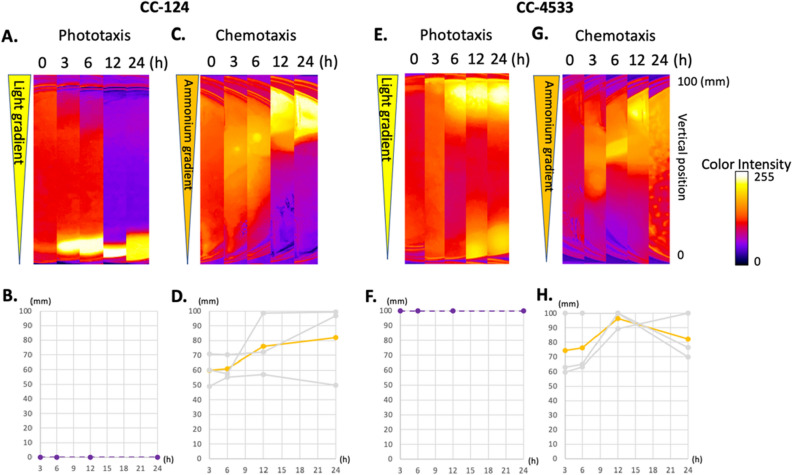
Figure 3.
Chlamydomonas exhibit collective cell migration during ammonium chemotaxis. Phototaxis and chemotaxis of CC-124 and CC-4533. The cells were exposed to light gradients (A, B, E, F) or chemical gradients (C, D, G, H). The light gradient (~ 30 μmol photons·m−2·s−1 at the open side of the converted box) was formed from the top to the bottom of the Petri dish in the images (shown as an elongated triangle). The chemical gradient (21 mM to 0 mM NH4Cl) was formed from the top to the bottom of the Petri dish in the images (shown as an elongated triangle). After setup, the photos were taken at 0, 3, 6, 12, and 24 h time points. Changes in the local cell densities in the Petri dish for CC-124 and CC-4533 were shown as heat maps (A, C, E, G). Changes in the density center in the center strip of the dish were graphed with a function of time (B, D, F, H). The bottom and top rims of the dish in the photos were defined as 0 and 100 mm, respectively. Grey lines are the results of three independent experiments. Colored lines are the average of the three experiments. Notice that the density centers in three independent experiments in phototaxis are always 0 and 100 mm in CC-124 and CC-4533, respectively. On the other hand, the density centers in three independent experiments in chemotaxis are first observed near the center of the Petri dish.

