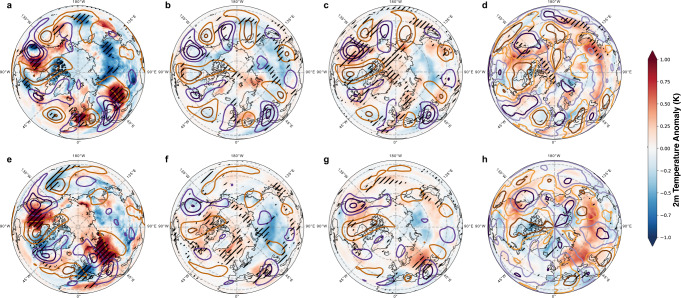
Fig. 1. Circumglobal wave-7 and 5 patterns and associated 2 m air temperature anomalies in ERA-5 reanalysis data and bias-adjusted CMIP6 models.
Meridional winds in m/s (contours; purple: southerly, orange: northerly winds, in (a–c, e–g) contours start at an absolute value of 3 m/s and increase/decrease by 3 respectively, in (d, h) contours start an absolute value of 0.5 and increase/decrease by steps of one) and near surface temperature anomalies filled contours during (a–c) wave-7 and (e–g) wave- 5 events relative to the respective climatology in the northern hemisphere summer (JJA) based on (a, e) ERA5 reanalysis (1960–2014), (b, f) historical (1960–2014) and (c, g) future (SSP5-8.5, 2045–2099) bias-adjusted output from CMIP6 simulations (four models). d, h) Difference in meridional winds and temperature response during wave events comparing historical and future patterns in four bias-adjusted CMIP6 models (for twelve non adjusted models see Fig. S6). Hatching shows statistical significance on a 95% confidence level (a, d, e, h) or 100% model agreement in sign (4 out of 4 models, b, c, f, g) While the phase positions and intensity of the wave patterns (line contour) are well represented in the models their surface imprint are considerably underestimated in historical simulations. Changes in the temperature response are identified over North America, Eurasia and East Asia (d, h).

