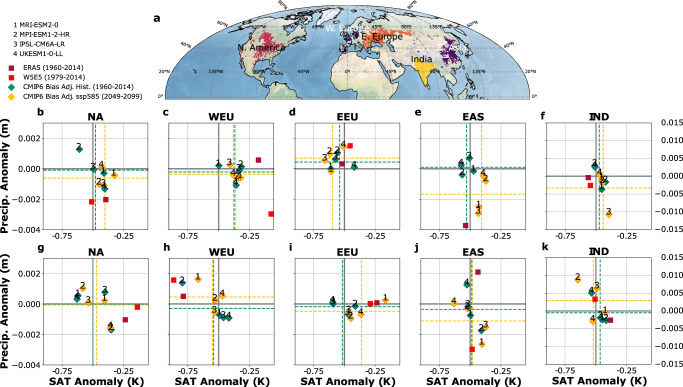
Fig. 2. Mean response in precipitation and 2 m temperature anomalies over major crop-producing regions during wave events in reanalysis data and CMIP6 climate models.
a Major crop producing regions in the Northern Hemisphere mid-latitudes defined by a threshold of 25% harvested area per grid-point. Weekly mean temperature and aggregated precipitation anomalies averaged over the regions outlined in (a) for (b–f) wave-7 and (g–k) for wave-5. We compare two different reanalysis datasets ERA-5 (dark red,1960–2014) and W5E5 (red, 1979–2014) with bias-adjusted output from four CMIP6 models under historical (green, 1960–2014) and future (2045–2099, SSP5-8.5, yellow) conditions, whereas their mean values are shown as dashed lines. Note the different y-axis range for (k) and (f) compared to the other panels. Temperature anomalies are dominantly underestimated in the bias-adjusted output in WEU (wave-7, wave-5), EEU and NA (wave-5). Precipitation anomalies are underestimated in NA, WEU (wave-7).

