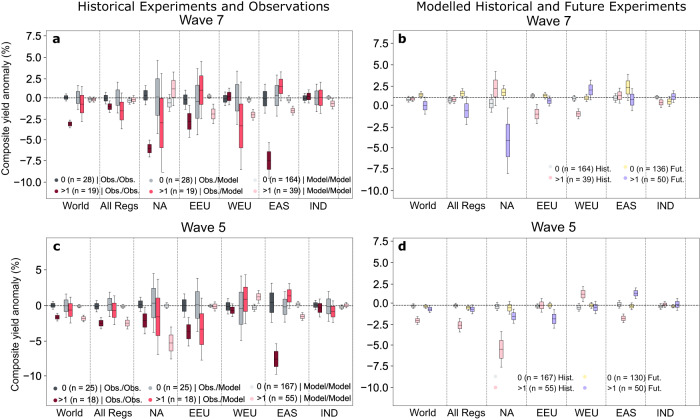
Fig. 3. Combined Wheat and Maize yield anomalies during wave event years in observations and models.
Composite yield anomalies based on wave events from ERA-5 reanalysis and annual reported national yield statistics from FAO (Obs/Obs), wave events from ERA-5 reanalysis and yield anomalies from a crop model (LPJmL) driven by reanalysis data (W5E5, Obs/Model) and crop model (LPJmL) driven by four bias-adjusted CMIP6 simulations (Model/Model) for (a) wave-7 and (c) wave-5 over the historical time period (1960–2014). Composites compare years in which two or more wave events are detected in JJA (red to purple bars) with the control case of years without such events (gray, light yellow bars). Bars and whiskers depict the distribution of 500 resampled replicate composite yield effects, where each replicated preserves the sample size of the underlying observations (wave events). Differences in detected wave events across datasets cause the difference in distribution variance. Differences in modelled crop impacts (both Obs/Model and Model/Model) are large compared to observations, but are smaller in some regions when driving the crop model with bias-adjusted reanalysis weather data (Obs/Model) instead of GCM simulations (Model/Model). (b, d) as in (a, b) but showing crop yield anomalies simulated by LPJmL based on historical (1960–2014) and future (SSP5-8.5, 2045–2099) simulations.

