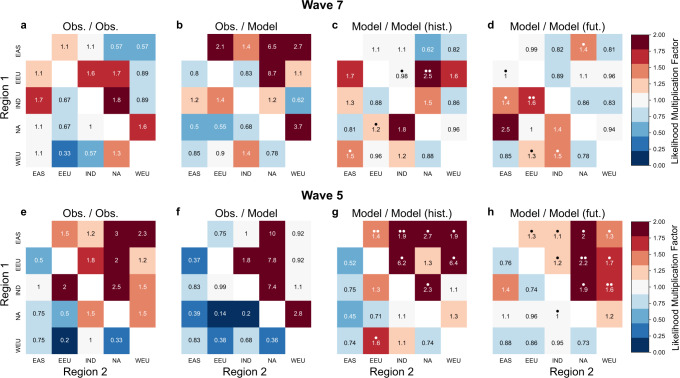
Fig. 4. Likelihood multiplication factors (LMF) of concurrent yield losses in observations and models.
LMF of concurrent negative yield anomalies of combined wheat and maize yield in two regions for wave-7 (a–d) and wave-5 events pear year (e–h) (upper right corner). LMF for concurrent positive yield anomalies are provided in the lower left corner of each heatmap. a, e Values based on ERA-5 and FAO data (1960–2014, Obs./Obs.). b, f Values based on wave events from ERA-5 and yield anomalies from LPJmL driven by W5E5 (Obs/Model.). LMF values for concurrent low and high yields differ significantly for (a, b, e, f) (Figs. S12–S15). Averaged LMF values based on LPJmL driven by four bias-adjusted CMIP6 models separately are shown for (c, g) historical experiments (1960–2014) and (d, h) future projections (2045–2099, SSP5-8.5). Model agreement is provided by dots where one dot indicates an agreement (above or below a LMF value of one) among three out of four models while two dots indicate an agreement among all four models.

