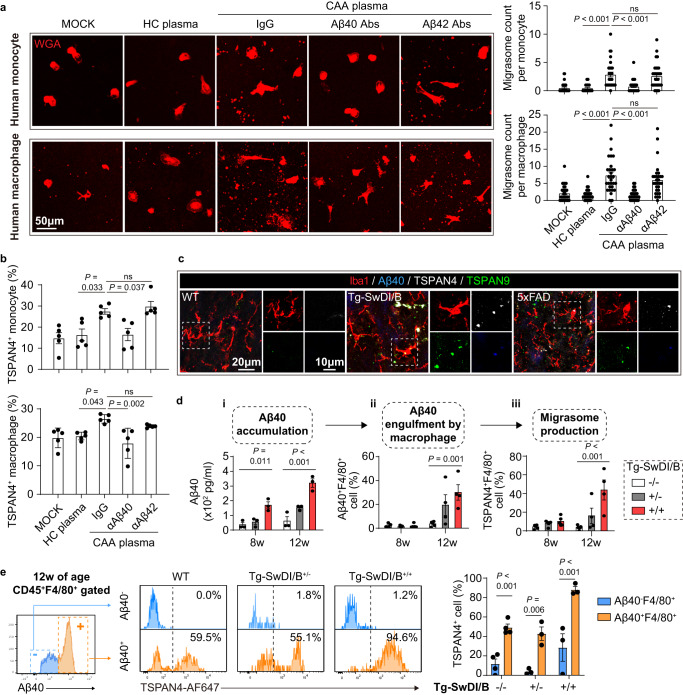
Fig. 2. Aβ40 phagocytosis elicits migrasome production in macrophages.
a, b Human monocytes were isolated from healthy donors. Human macrophages were induced with monocytes with human serum and MCSF. CAA plasma with or without Aβ40/Aβ42 removal or HC plasma was treated to monocytes/macrophages with a concentration of 10% in culture system for 6 h. a Immunolabeling of WGA to display migrasome production. Migrasomes of 30 cells in each group were subjected to the analysis. Data are presented as mean values ± SEM with the indicated significance (by one-way ANOVA followed by Tukey’s post-test). b Expression of TSPAN4 in monocytes/macrophages after plasma treatment as assessed with flow cytometry. Samples from 5 individuals in each group were subjected to the analysis. Data are presented as mean values ± SEM with the indicated significance (by one-way ANOVA followed by Tukey’s post-test). c Coronal brain sections from Tg-SwDI/B+/+ and 5xFAD mice or age- and sex-matched WT mice (24w of age) were collected and subjected to immunostaining of Iba1, Aβ40 and TSPAN4 and TSPAN9. Brain slices from 4 independent mice were subjected to the experiments. Representative images were displayed. d, e Tg-SwDI/B+/+, Tg-SwDI/B+/- and WT mice were sacrificed at indicated age. (d-i) Plasma Aβ40 concentration was assessed with ELISA. d-ii, iii Leukocytes of mice were isolated and subjected to flow cytometric analysis of Aβ40 engulfment (CD45+F4/80+Aβ40+) d-ii and TSPAN4 expression (CD45+F4/80+TSPAN4+) in macrophages (d-iii). N = 3 in Tg-SwDI/B+/+ group, N = 3 in Tg-SwDI/B+/- group, N = 4 in WT group. Data are presented as mean values ± SEM with the indicated significance (compared with WT by one tail one-way ANOVA followed by Tukey’s post-test). e Comparison of TSPAN4 expression in CD45+F4/80+ cells with (Aβ40+) or without (Aβ40-) Aβ40 engulfment at 12w of age. N = 3 in Tg-SwDI/B+/+ group, N = 3 in Tg-SwDI/B+/- group, N = 4 in WT group. Data are presented as mean values ± SEM with the indicated significance (compared with WT by two-tailed Student’s t test). Source data are provided as a Source Data file.

