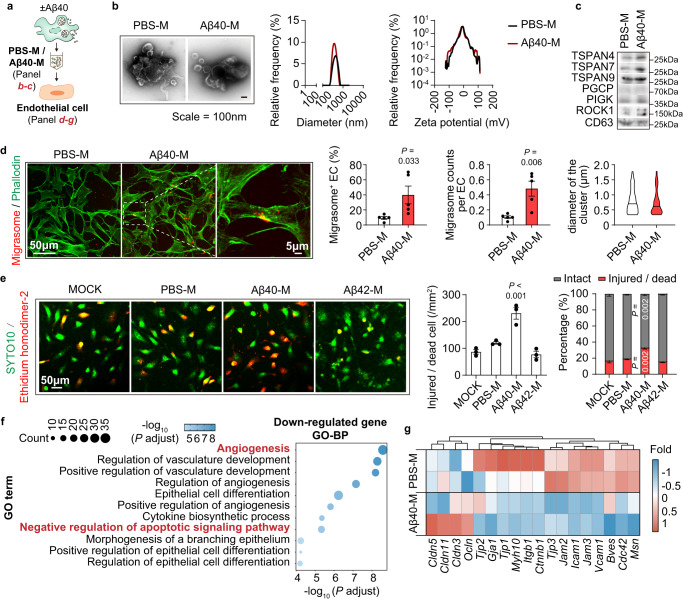
Fig. 3. Migrasomes derived from Aβ40-stimulated macrophages are injurious to blood vessel endothelial cells.
a Diagram of migrasome collection and treatment to endothelial cells. b Left: representative TEM images of the isolated migrasomes after negative staining. Middle: diameter of PBS-M and Aβ40-M. Right: Zeta potential of the isolated migrasomes. Data are representative of 3 biologically independent experiments. Lines in plots represent mean values. c Expression of migrasome markers in the purified migrasomes was assessed with western blot. Data are representative of 3 biologically independent experiments. d–g Migrasomes were treated to endothelial cells at a concentration of 50 μg/ml for 2 h. d Frequency of endothelial cells (green) attached with migrasomes (red) and the number of migrasomes bond to each endothelial cell were calculated. Data are representative of 5 biologically independent experiments. Diameter of cluster for PBS-M (N = 201) and Aβ40-M (N = 160) was also quantified. Data are presented as mean values ± SEM with the indicated significance (by two-tailed Student’s t test). e Endothelial cells were treated with PBS-M, Aβ40-M or Aβ42-M then subjected to SYTO10 and Ethidium homodimer-2 staining. The number of intact cells (SYTO10+Ethidium homodimer-2-) and injured/dead cells (SYTO10+Ethidium homodimer-2+) was calculated. Data are representative of 3 biologically independent experiments. Left: representative images showing the cytotoxic property. Middle: Comparison of injured/dead cells in endothelial cells treated with PBS-M, Aβ40-M or Aβ42-M. Right: Percentage of intact cells (grey bars) and injured/dead cells (red bars) in PBS-M-, Aβ40-M- or Aβ42-M-treated endothelial cells. Data are presented as mean values ± SEM with the indicated significance (compared with MOCK by one-way ANOVA followed by Tukey’s post-test). f–g Endothelial cells were treated with 50 μg/ml of PBS-M or Aβ40-M for 2 h then subjected to bulk RNAseq. N = 2 in each group. f Gene Ontology-biological process (GO-BP) enrichment of the downregulated genes in Aβ40-M treated endothelial cells. g Heatmap showing the transcription of tight junction protein related genes of PBS-M and Aβ40-M treated endothelial cells. Source data are provided as a Source Data file.

