Figure 9.

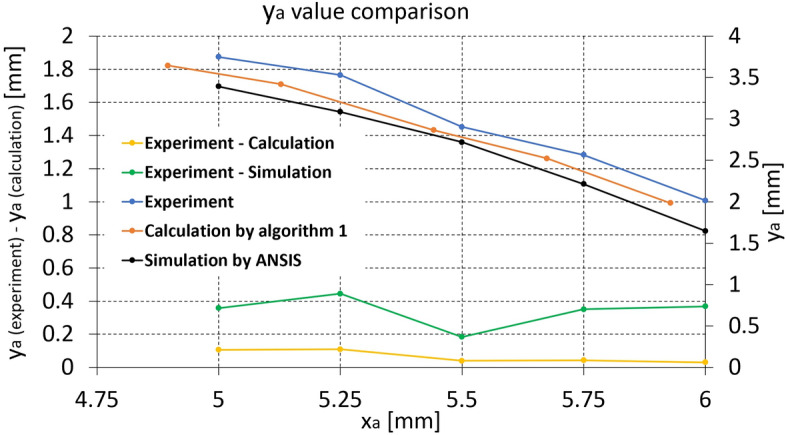
y value comparison between experiment, calculation by Algorithm 1, and FEM simulation for the mapping catheter sensor prototype (Experiment—Calculation (yellow) and Experiment—Simulation (green) graphs are plotted against left axis).

y value comparison between experiment, calculation by Algorithm 1, and FEM simulation for the mapping catheter sensor prototype (Experiment—Calculation (yellow) and Experiment—Simulation (green) graphs are plotted against left axis).