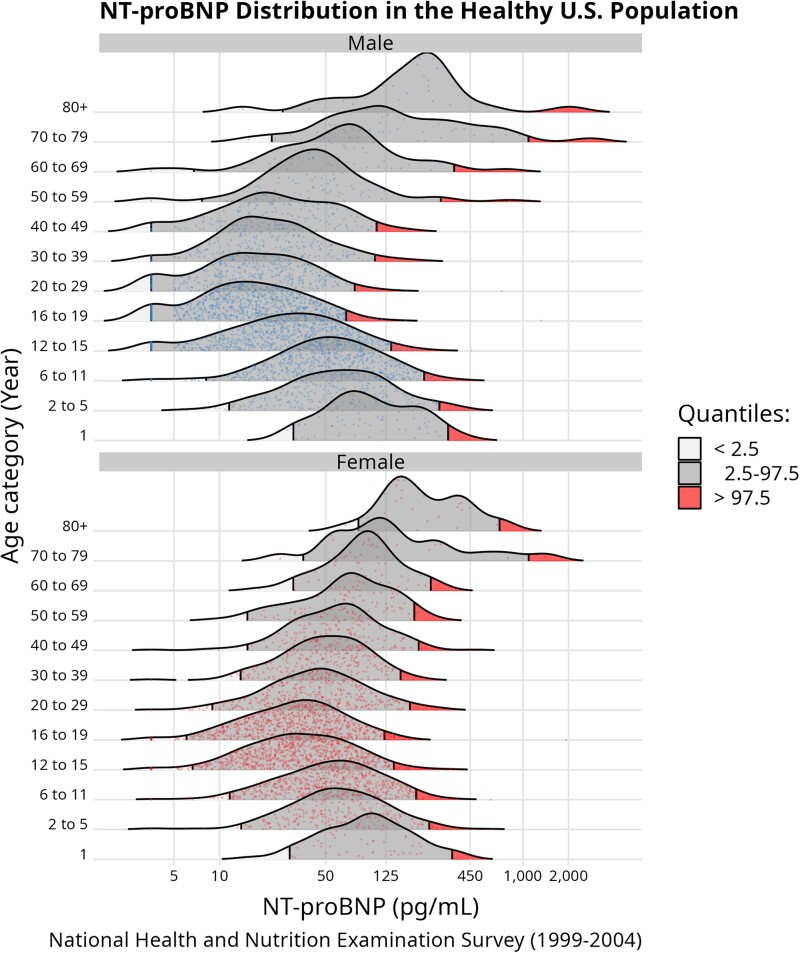
Fig. 2.
NT-proBNP distribution in the healthy US population. This ridgeline plot shows the NT-proBNP distribution in healthy NHANES participants from survey cycles 1999–2004, partitioned by age category and sex. Survey weight information was incorporated in the quantile calculation and individual measurements are plotted within the density curve. The portions of the distribution above the 97.5th percentile are shaded in red. The increased densities at the lower portions of the NT-proBNP distributions is an artifact of the limit of detection of the NT-proBNP assay, where all values below 5 ng/L are replaced with 3.54 ng/L.

