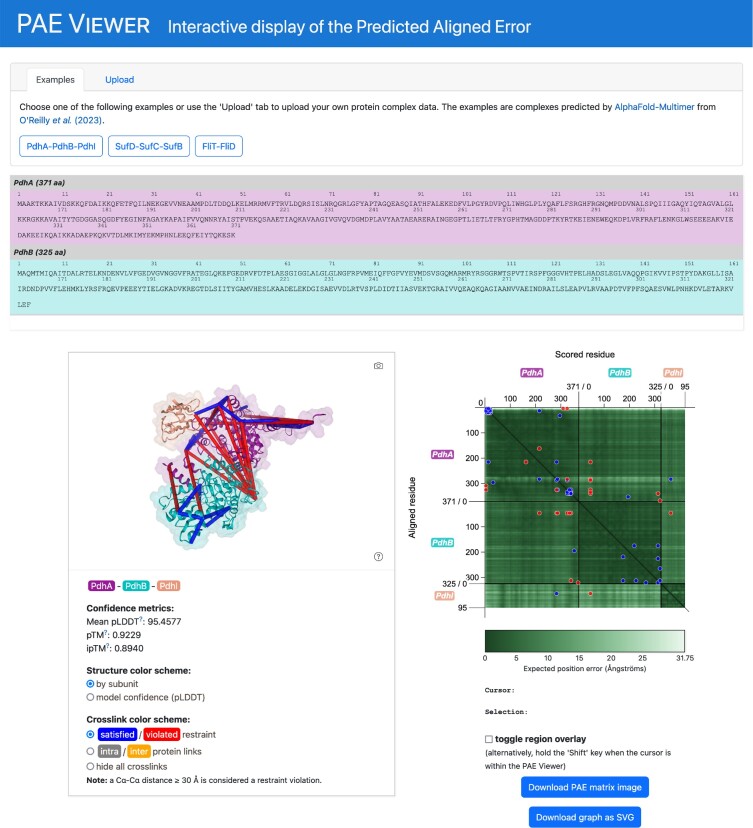
Figure 1.
Overview of the PAE Viewer webserver page. The panel at the top of page allows to select structure data from several examples and to upload custom data. Below, the dynamic sequence viewer presents the amino acid sequences of the viewed multimer prediction. Further down on the left, a 3D structure viewer shows a molecular representation of the predicted multimer. Additionally, quality metrics and presentation options are provided. On the right, the PAE Viewer is embedded.

